
DATA ANALYST
Portfolio
by

Hello, welcome to my portfolio. I am a certified data analyst with a passion for using Python to solve big data problems.
As a multidisciplinary professional, I offer a unique set of skills and experiences that allow me to deliver high-quality work across various industries and sectors bringing vast digital transformation.
GODWIN KOKOH


About me
GODWIN KOKOH
I am a DATA ANALYST/DIGITAL MARKETING ANALYST
As a data analyst, I am passionate and enthusiastic about turning complex data sets into meaningful insights that can help organizations make informed decisions. I have experience using various statistical and data visualization tools such as Python Jupyter Notebook, Power BI, MySQL, and Google Analytics.
My expertise in data analysis allows me to identify trends, patterns, and opportunities for improvement that can help organizations streamline their operations and improve their bottom line.
I have worked on projects as an individual such as analyzing Covid Data, 4 famous Hollywood Directors and their globetrotting films, Spotify Streaming Playlist etc. And I have also contributed to projects on Github, such as the International-Debt-Statistics using data obtained from World Bank API.

PROJECTS
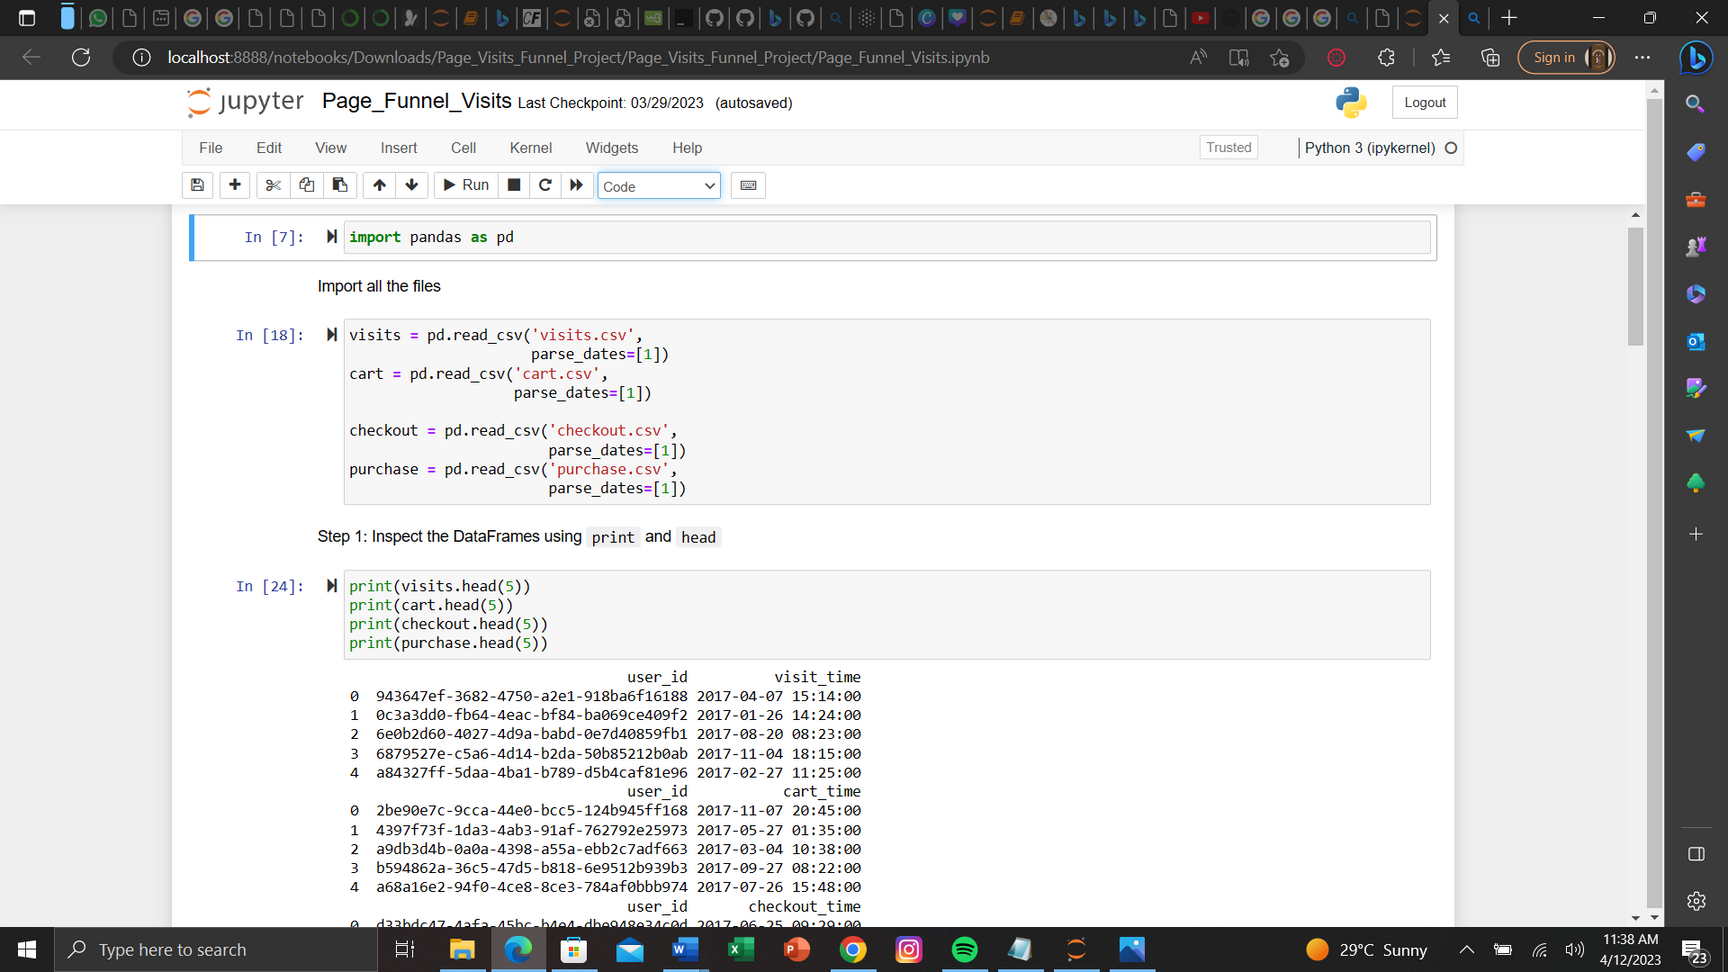
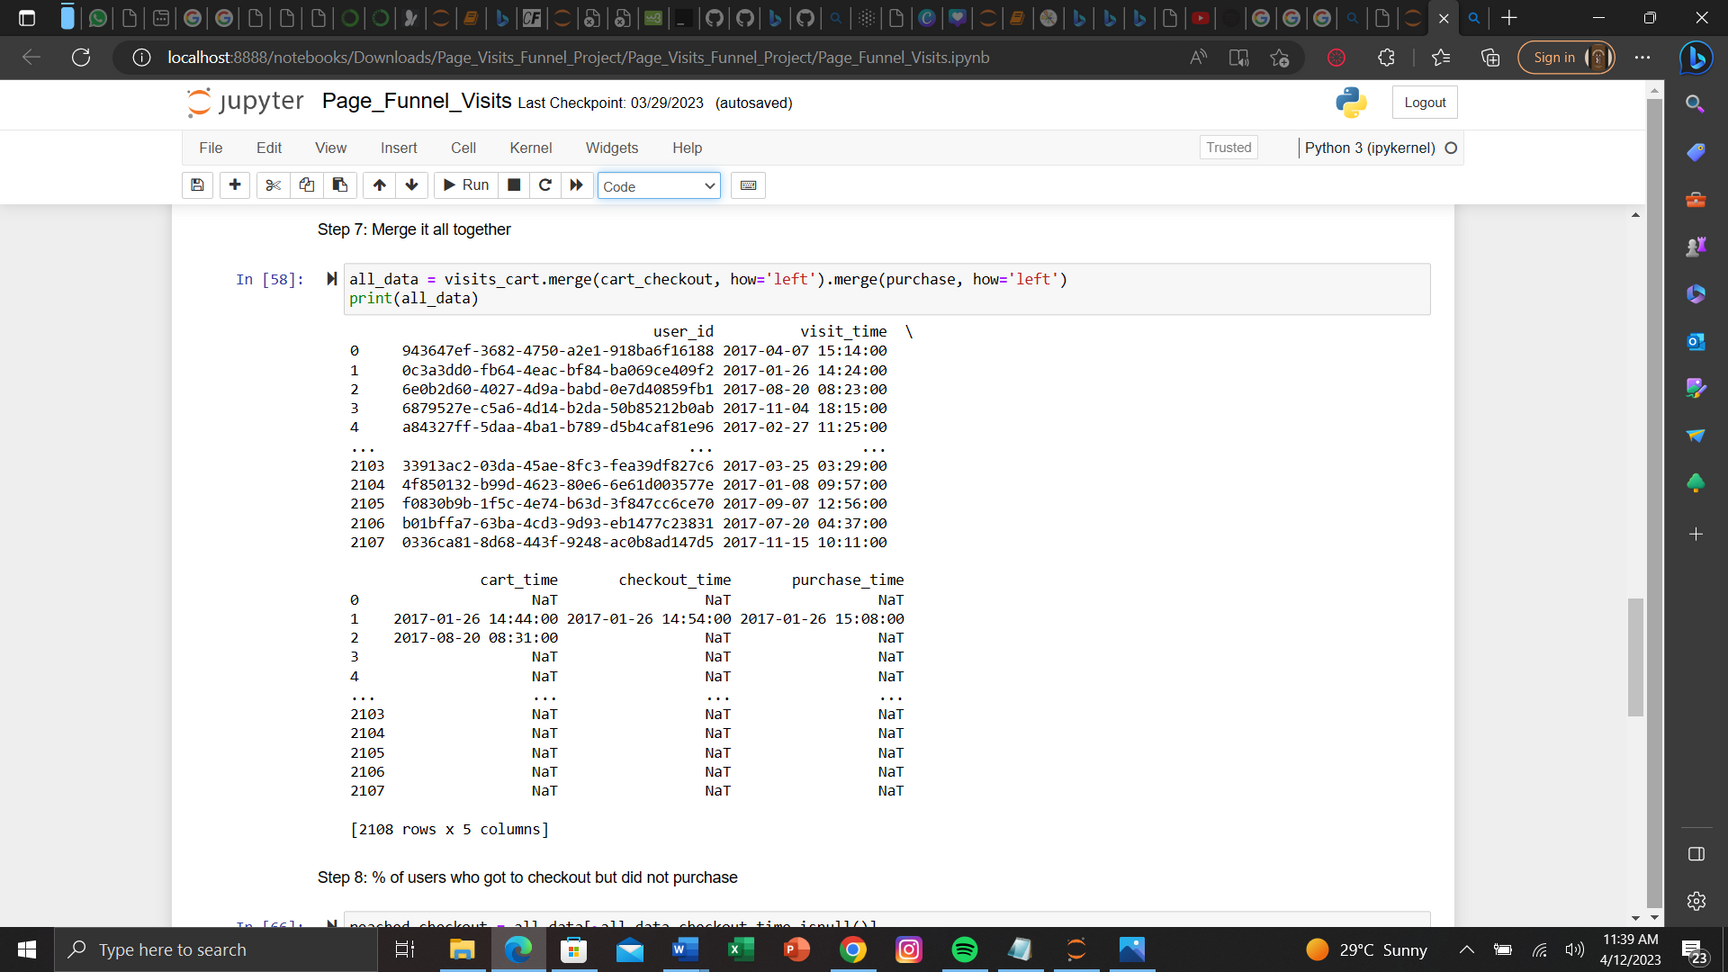
Title: Analysis of E-commerce Page Visit Data: Understanding Customer Interaction and Purchase Conversion (PYTHON JUPYTER NOTEBOOK)
Introduction:
The purpose of this project was to analyze the page visit data of an e-commerce website in order to gain insights into how customers interacted with the website and determine the percentage of visitors who completed a purchase. By understanding customer behavior and conversion rates, the project aimed to provide actionable recommendations to optimize the website's design and user experience, thereby enhancing overall customer satisfaction and improving conversion rates.
Methodology
Data Collection
Page visit data, including timestamps, user actions, and purchase status, were collected from the e-commerce website's analytics platform.
Additional demographic information, such as customer age, gender, and location, was also collected, if available, to enable further analysis.
Data Cleaning and Preprocessing
The collected data underwent thorough cleaning and preprocessing to eliminate any inconsistencies, missing values, or duplicates.
Data normalization techniques were applied to ensure fair comparisons across different customer segments, if demographic data was available.
Customer Interaction Analysis
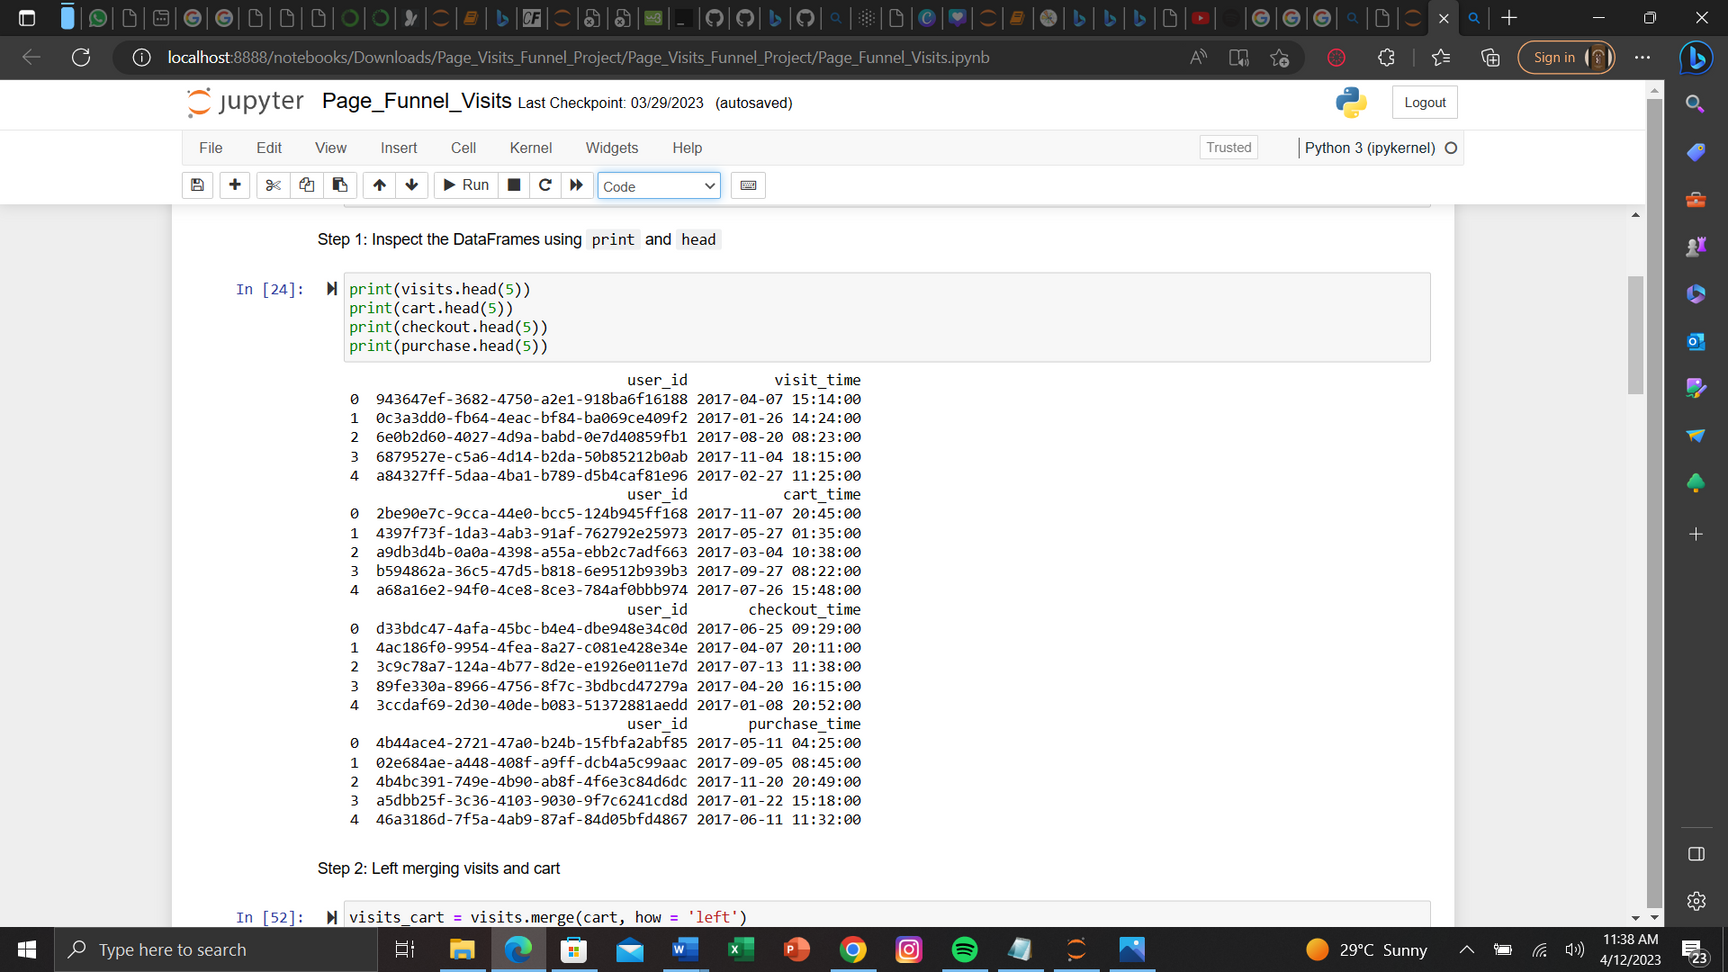
The data was analyzed to understand the customer journey and interaction patterns.
Key metrics, such as average time spent on each page, most frequently visited pages, and popular navigation paths, were derived to identify user preferences and potential areas of improvement.
Purchase Conversion Analysis
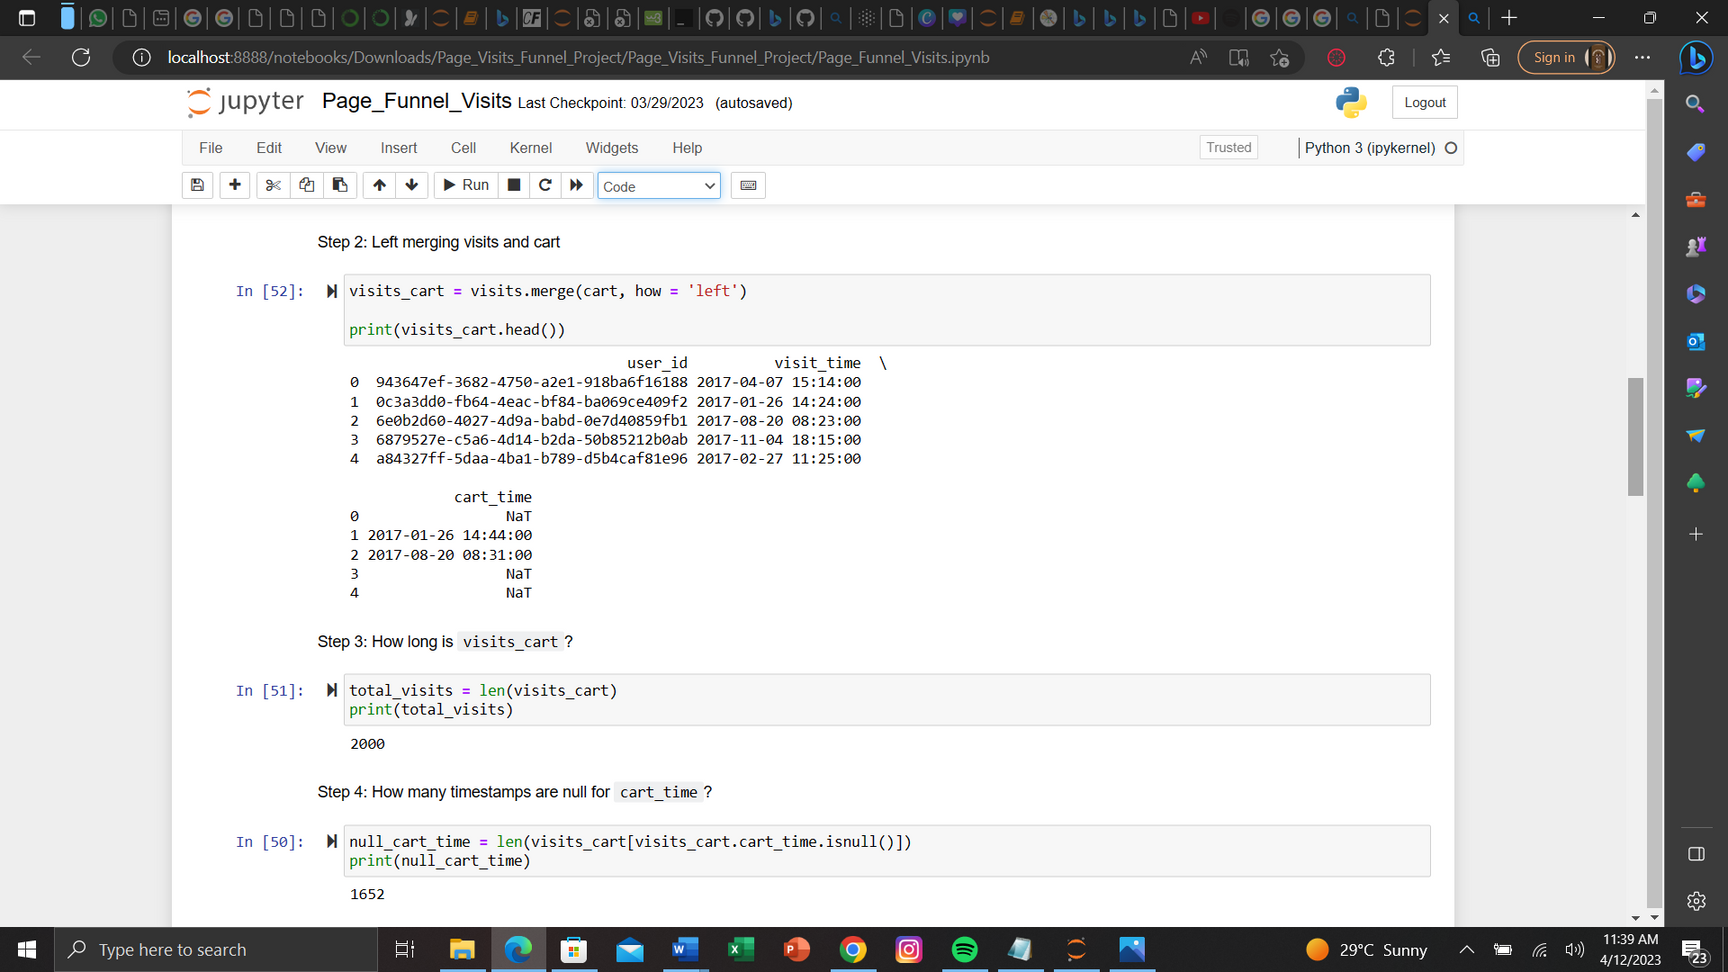
The data was segmented to distinguish visitors who completed a purchase from those who did not.
Conversion rates were calculated by dividing the number of purchases by the total number of visitors during the analysis period.
The purchase behavior of different customer segments (if available) was explored to identify any variations or trends.
Statistical Analysis
Statistical techniques, such as hypothesis testing or correlation analysis, were applied to uncover relationships between customer behavior metrics and purchase conversion rates.
Insights gained from statistical analysis were used to validate findings and guide decision-making processes.
Results and Findings
Customer Interaction:
Identified the most frequently visited pages and navigation paths, providing insights into popular sections of the website.
Determined the average time spent on each page, indicating which pages may require optimization to reduce bounce rates and improve engagement.
Purchase Conversion
Calculated the overall purchase conversion rate, providing an understanding of the website's effectiveness in converting visitors into customers.
Explored conversion rates across different customer segments (if available) to identify any variations in purchasing behavior.
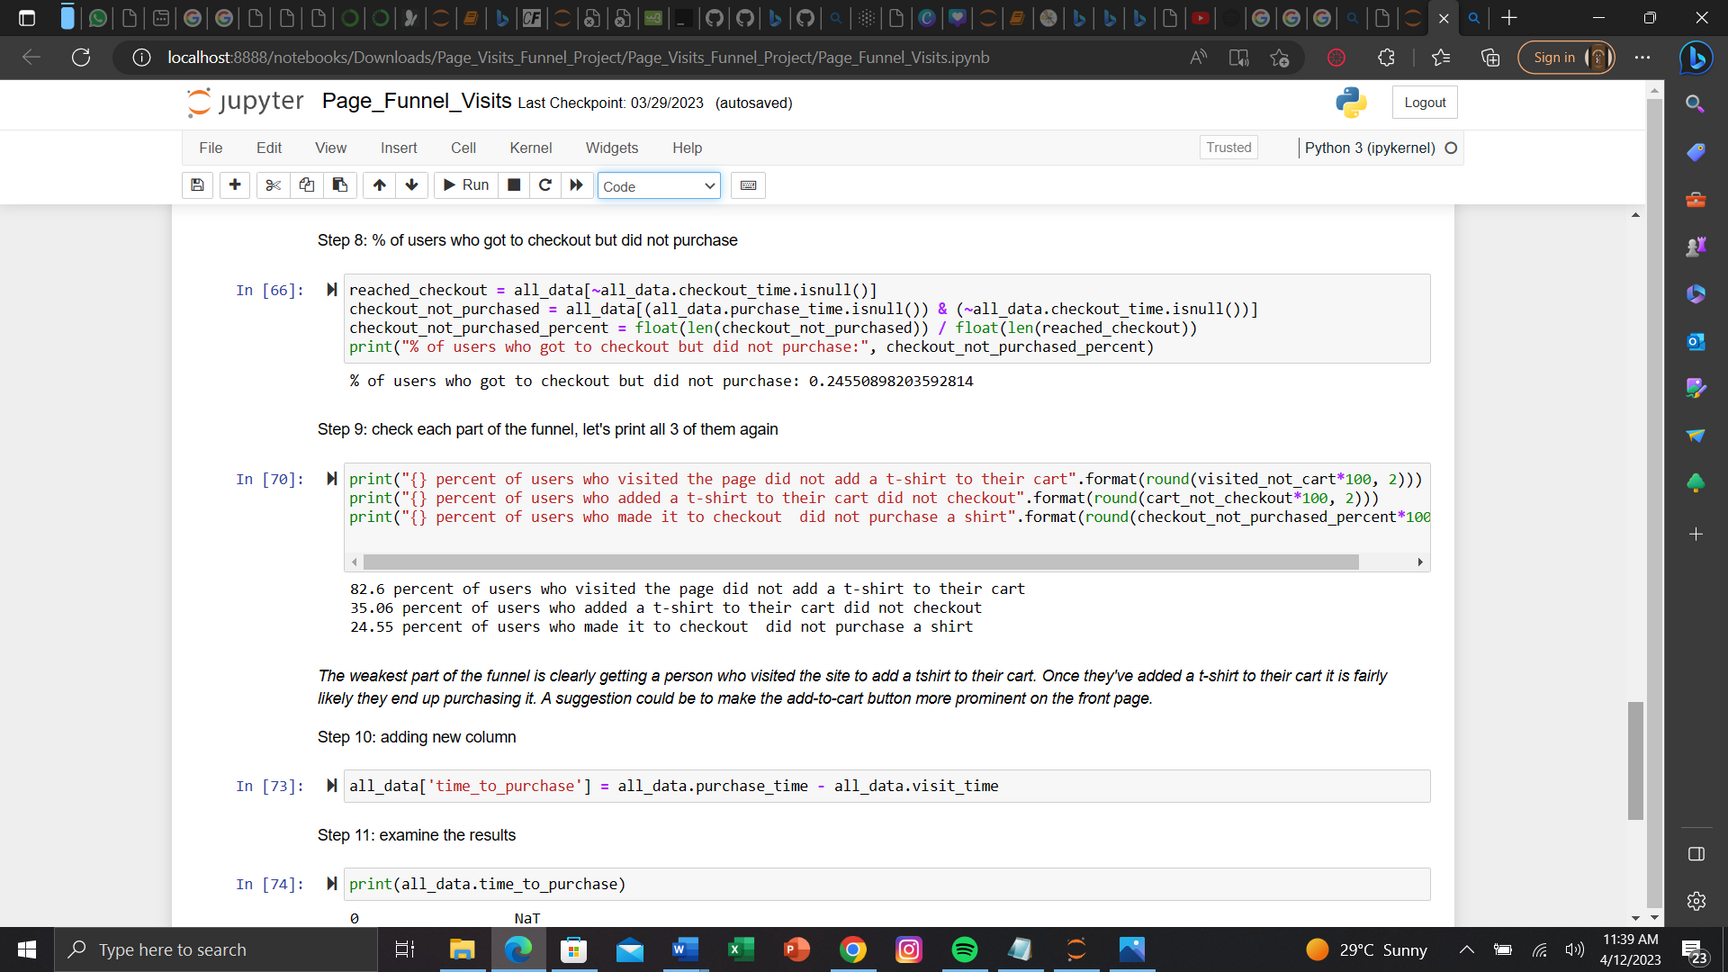
Insights and Recommendations
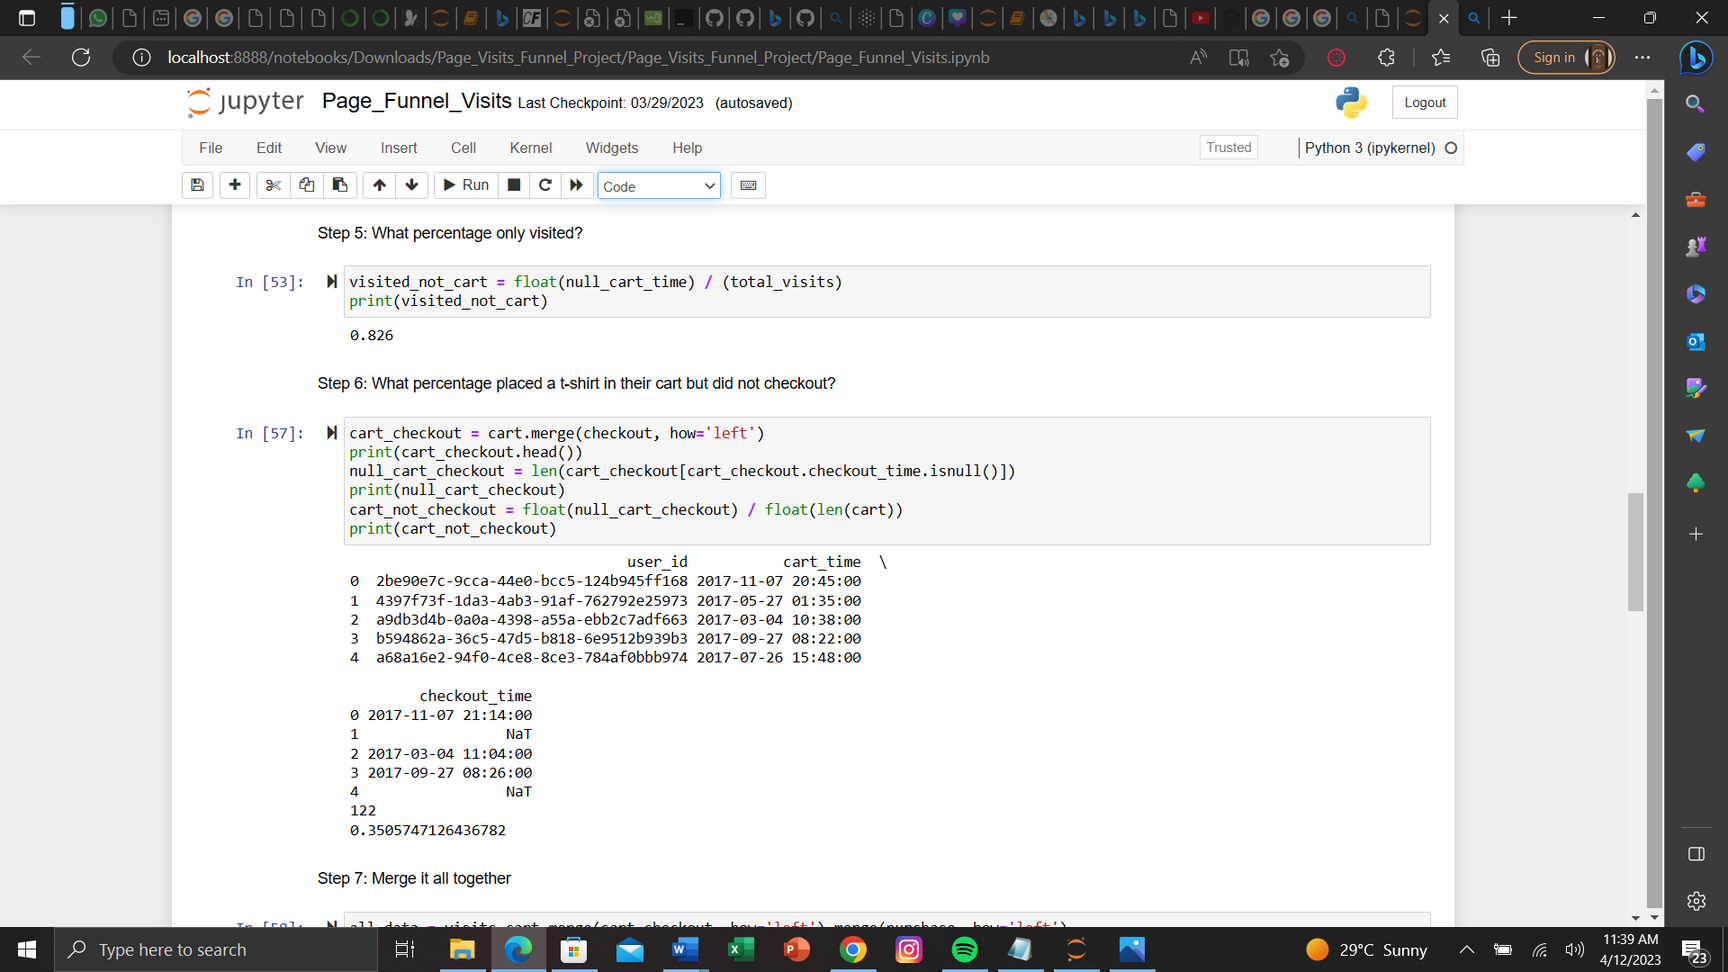
Identified potential bottlenecks or areas where users drop off before making a purchase, suggesting improvements to optimize the conversion funnel.
Suggested website design enhancements, such as improving user interface elements, simplifying the checkout process, or implementing personalized recommendations to boost conversion rates.
Conclusion
This e-commerce page visit data analysis project provided valuable insights into customer behavior and purchase conversion rates. By understanding how customers interacted with the website and identifying areas for improvement, actionable recommendations were generated to optimize the website's design and enhance the user experience. Implementing these recommendations has the potential to increase the conversion rate and ultimately improve the e-commerce website's overall performance.
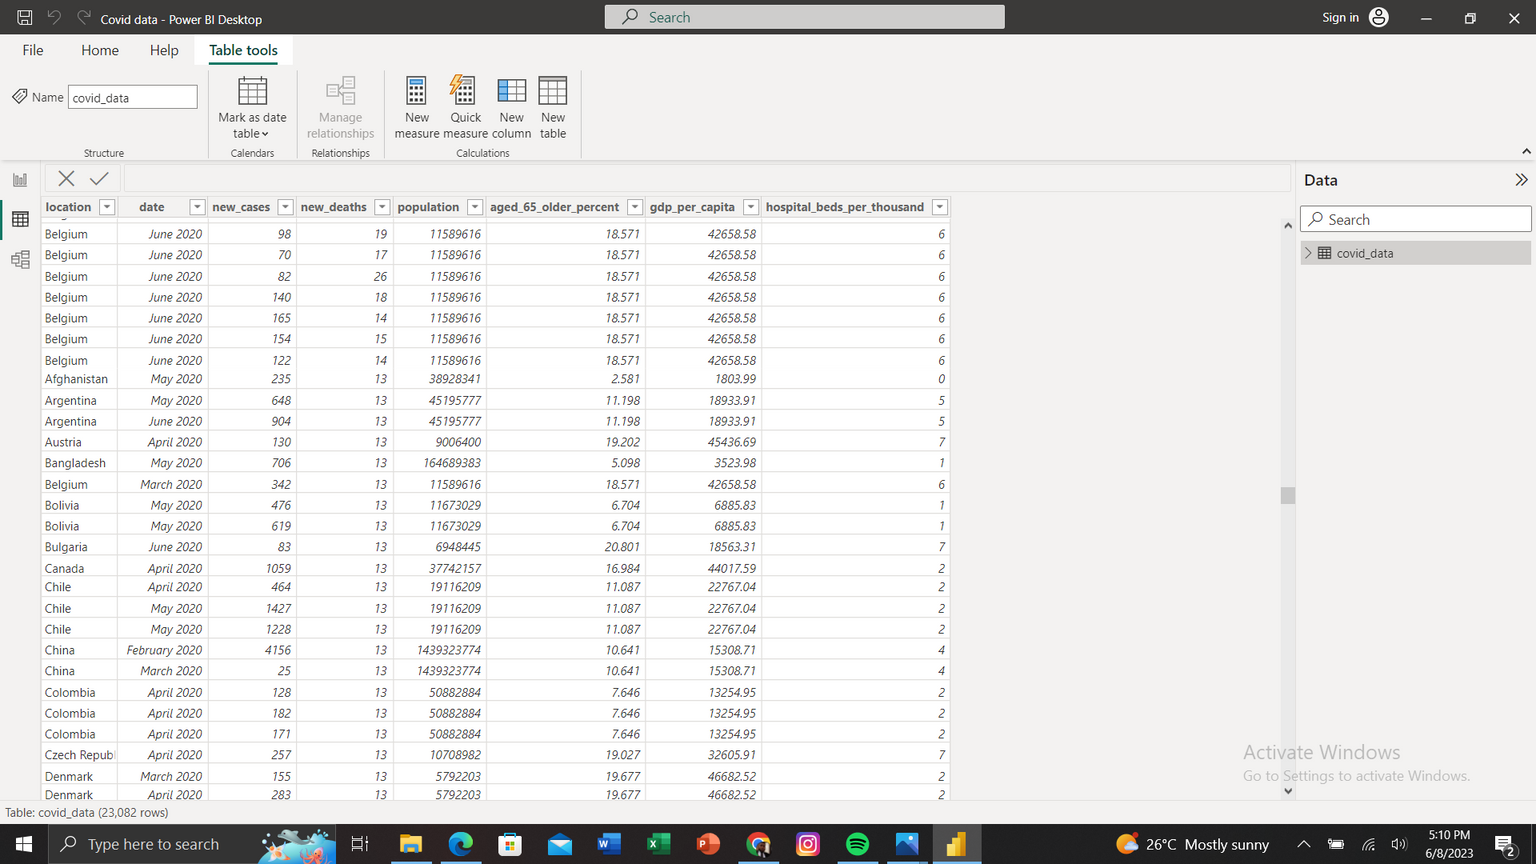
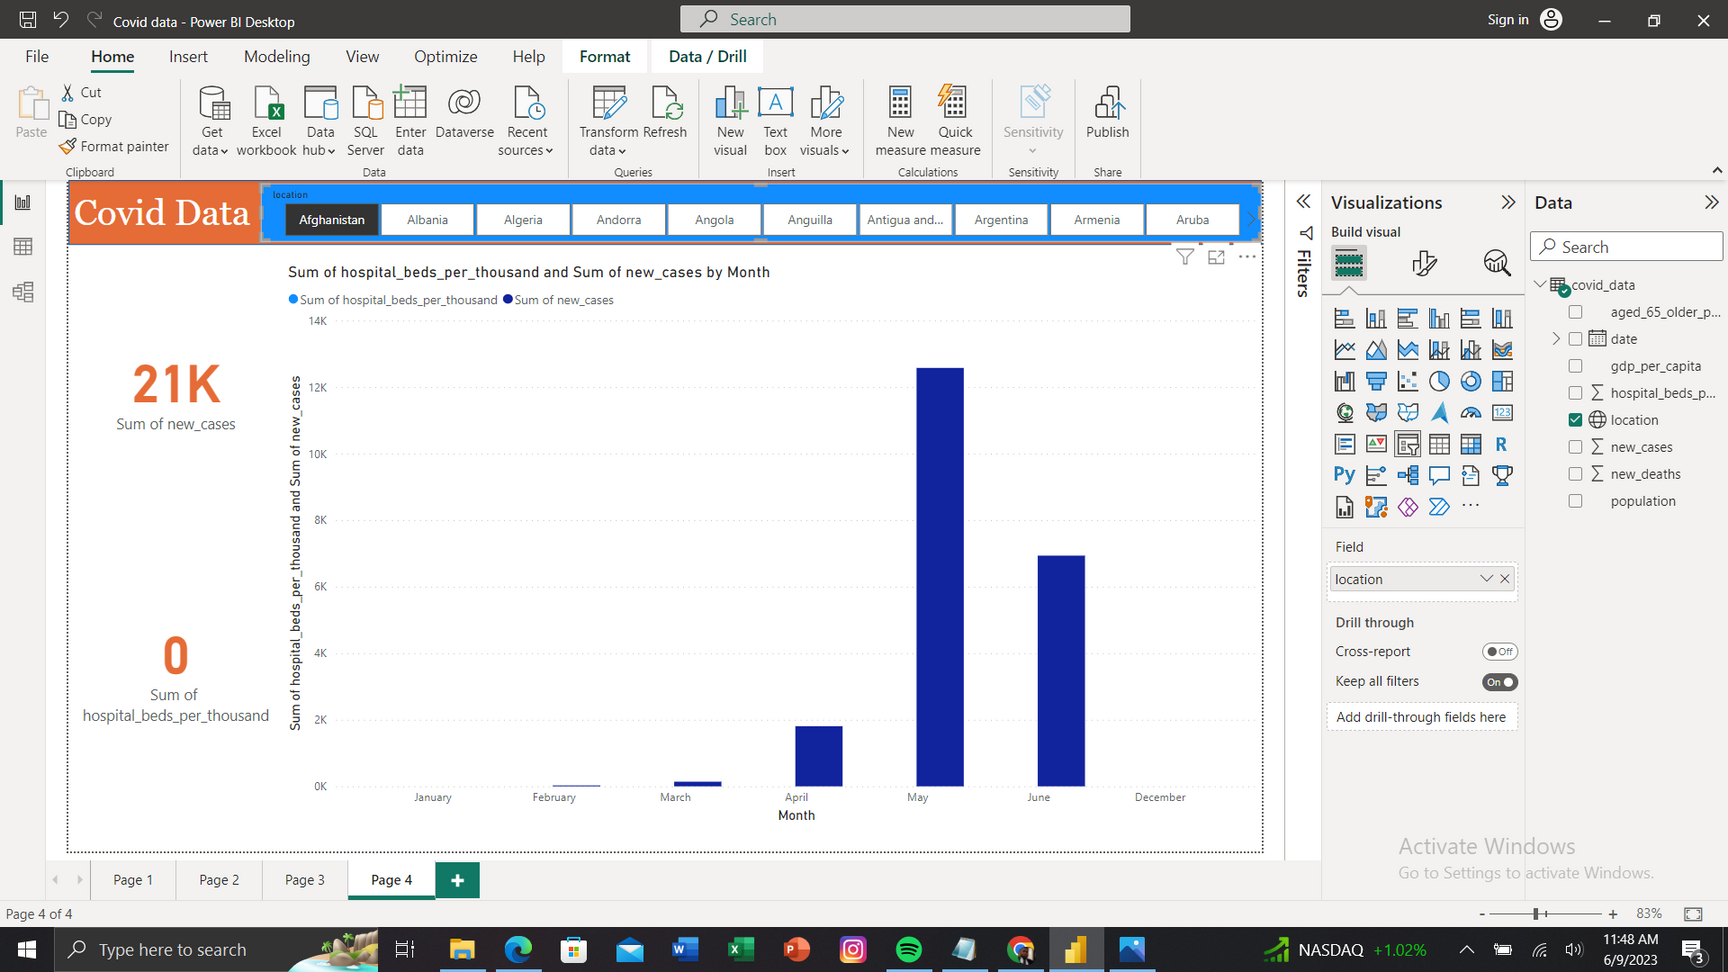
TITLE: COVID-19 Data Report (DATA VISUALIZATION USING POWER BI)
Introduction: This data visualization report provides a summary of key insights and trends based on the available COVID-19 data. The data spans multiple countries and regions and aims to provide a comprehensive understanding of the pandemic's impact.
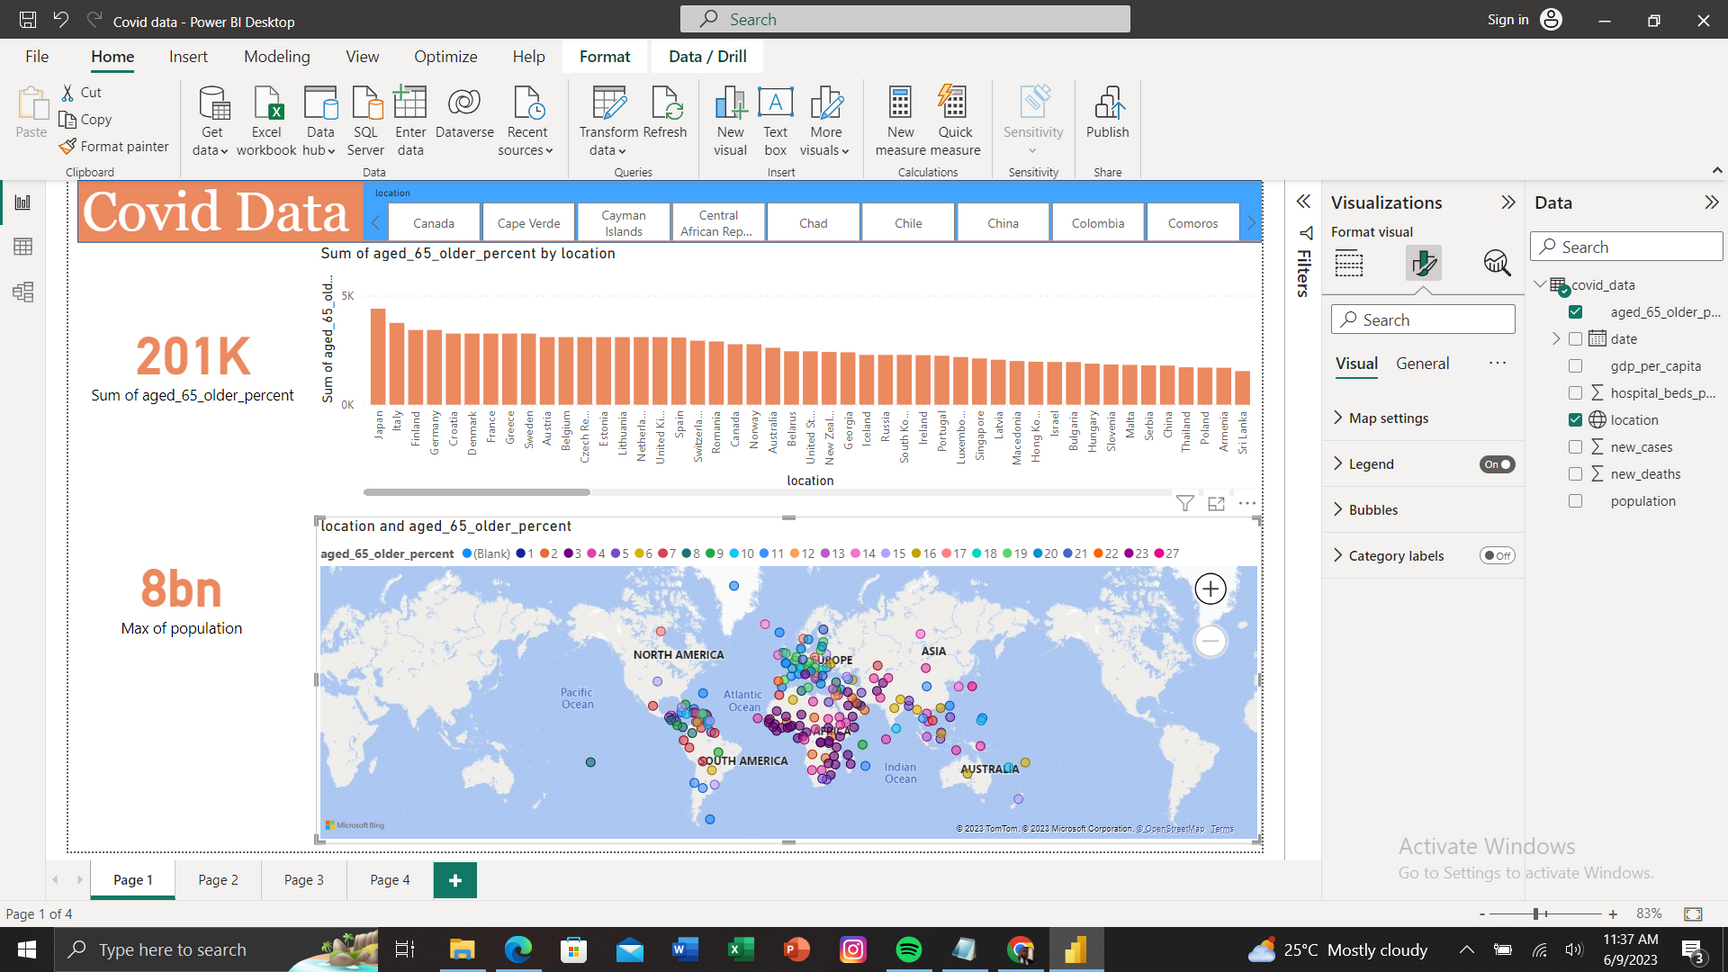
Demographic Impact:
It has rapidly affected the individuals aged 65 and older, and vulnerable groups across countries, The percentage ranging from 114.40% to 2704.09% monthly.
Areas with a higher percentage of elderly population have experienced increased strain on healthcare systems.
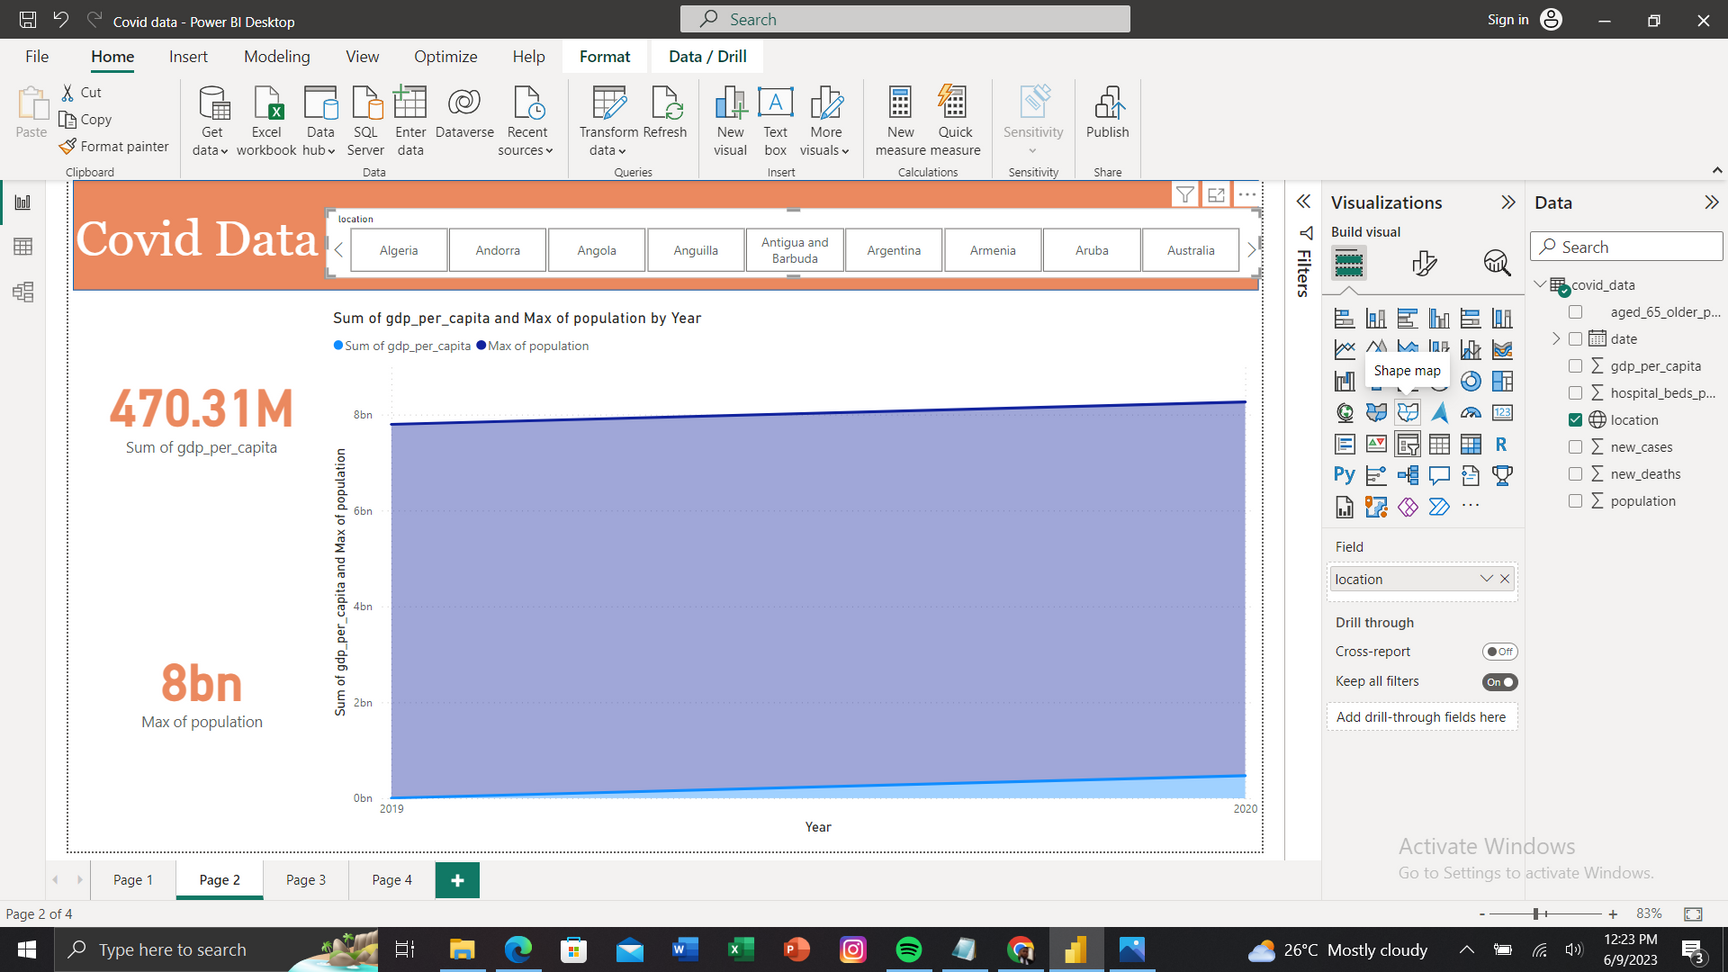
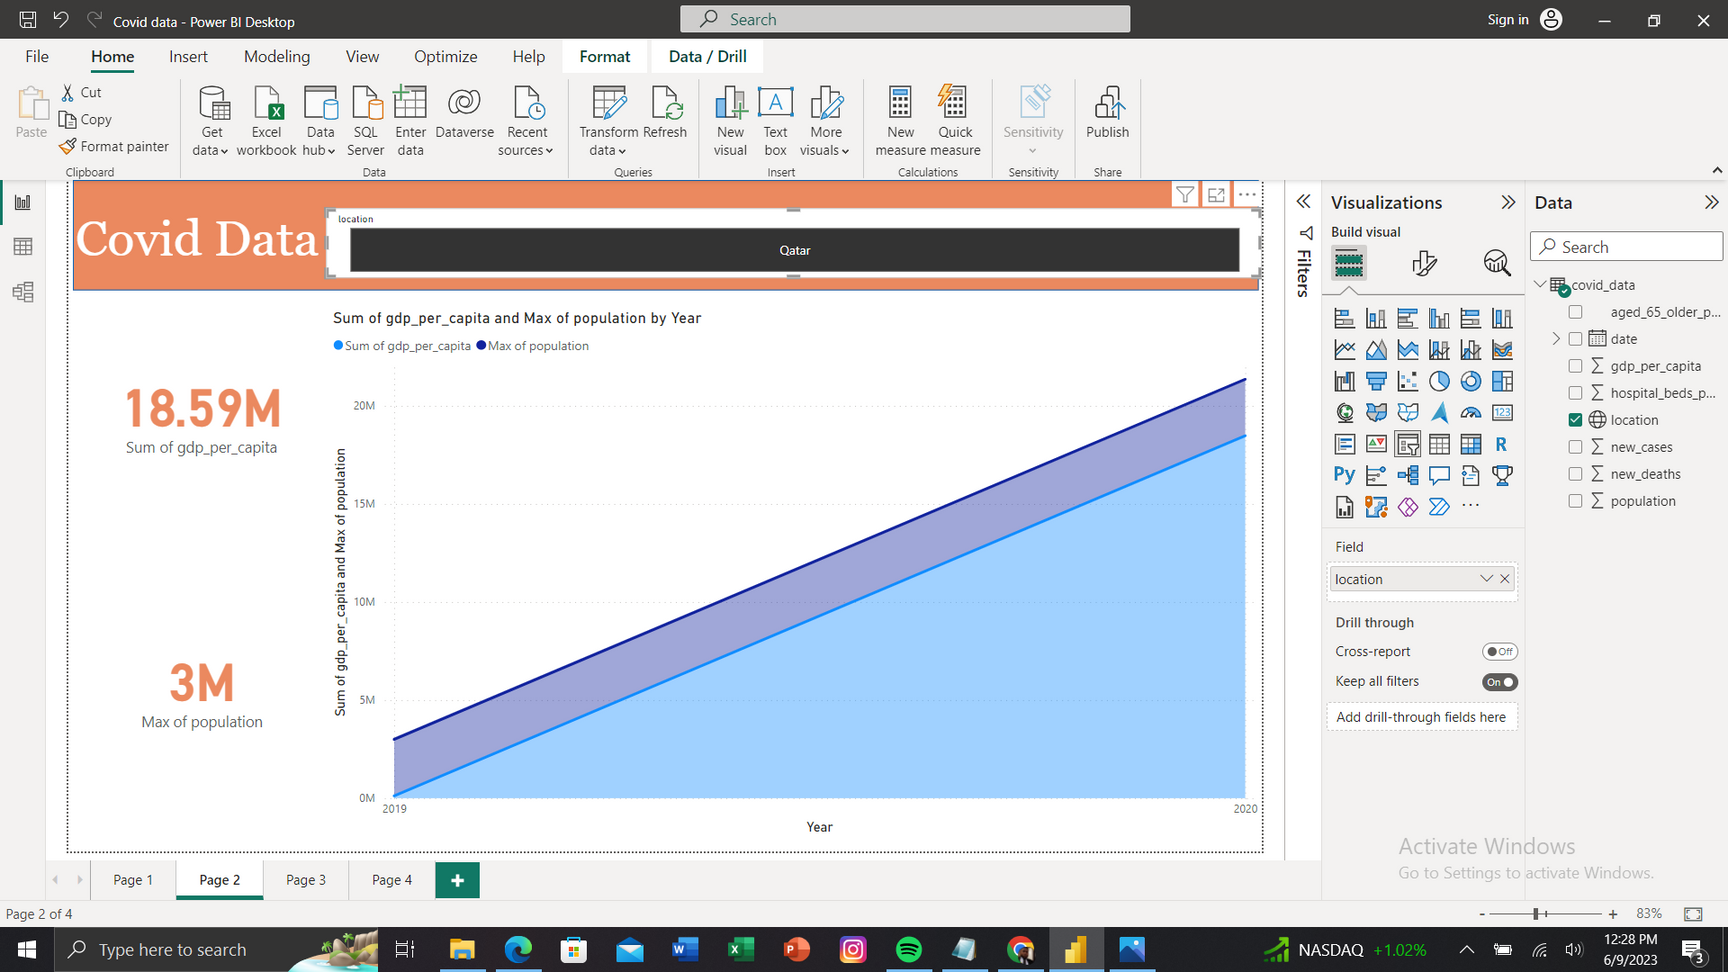
Economic Indicators:
GDP per capita reflects the economic impact of the pandemic, with varying degrees of resilience and recovery across countries.
African region has experienced negative economic growth (Especially the Central African Republic), while Asian region ( Mostly China, where the first cases where recorded) faces challenges in economic stability.
Qatar has the best GDP per capita during the pandemic in 2020.
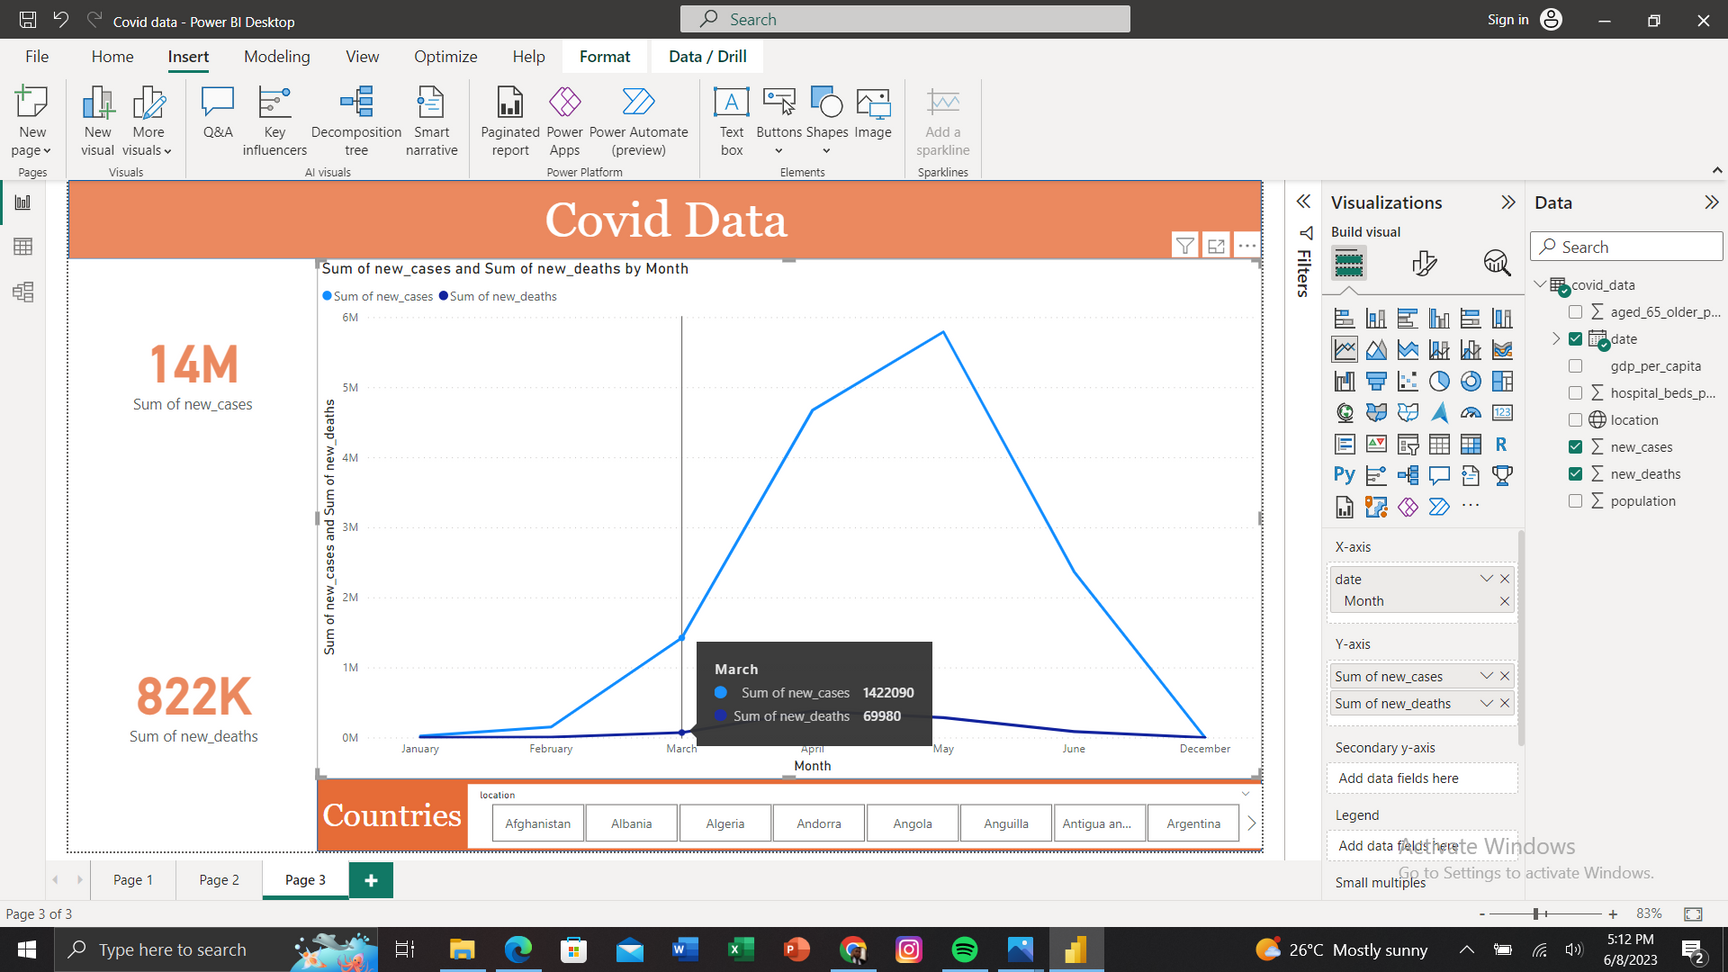
New Cases and Deaths:
Daily new cases have been fluctuating, indicating dynamic transmission rates.
Recent trends show a slight increase/decrease in new cases compared to the previous period.
The number of daily new deaths has also shown variations, reflecting changes in the virus's severity.
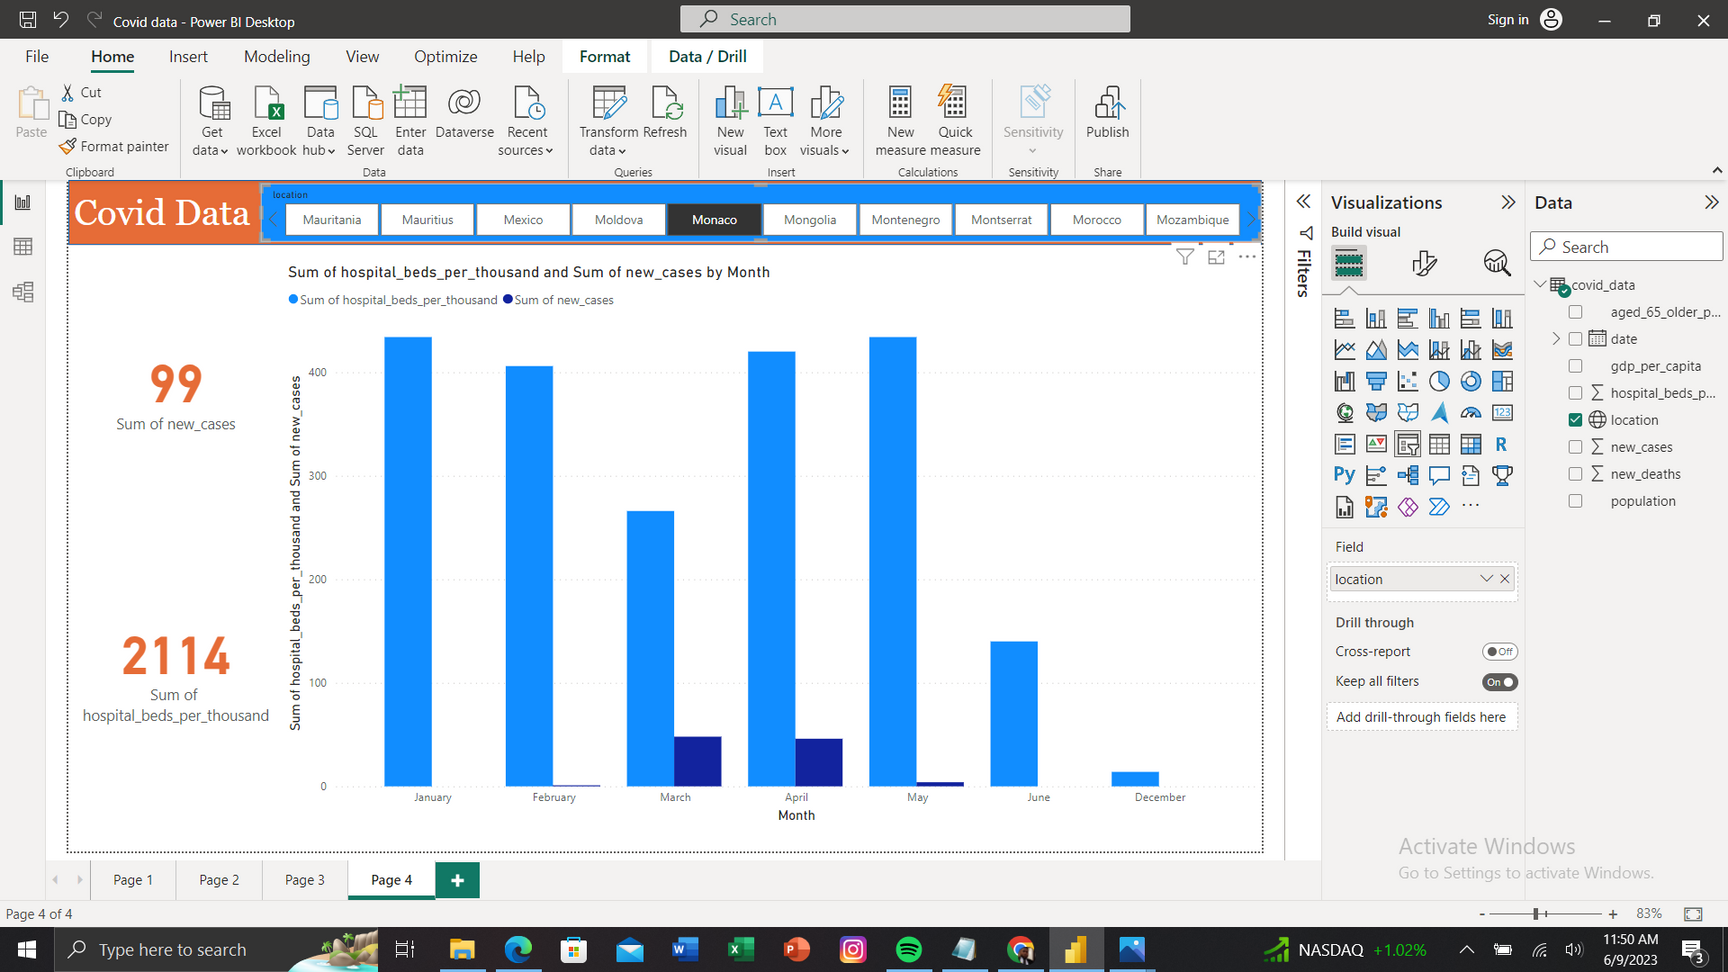
Healthcare Capacity:
The availability of hospital beds is a crucial factor in managing the pandemic. Monaco has a higher number of hospital beds per thousand people (1 new case in May 2020 to 14 beds per thousand people), enabling better healthcare support.
In contrast, Afghanistan faces challenges due to limited hospital bed capacity (1063 new cases in May 2020 to 0 bed per thousand people).
Regional Analysis
As at September 2021, the United States has experienced the highest number of COVID-19 cases and the highest number of deaths.
Conclusion
The COVID-19 pandemic continues to pose a global challenge, with the number of cases and deaths rising. Vaccination efforts are progressing, but the strain on healthcare systems remains a concern. The economic impact has been substantial, affecting various sectors and regions differently. Ongoing monitoring, preventive measures, and targeted interventions are crucial to mitigating the spread of the virus and minimizing its impact on public health and the economy.
Note that the findings and statistics presented in this report are based on the available data up to June 2020, and the situation may evolve rapidly.
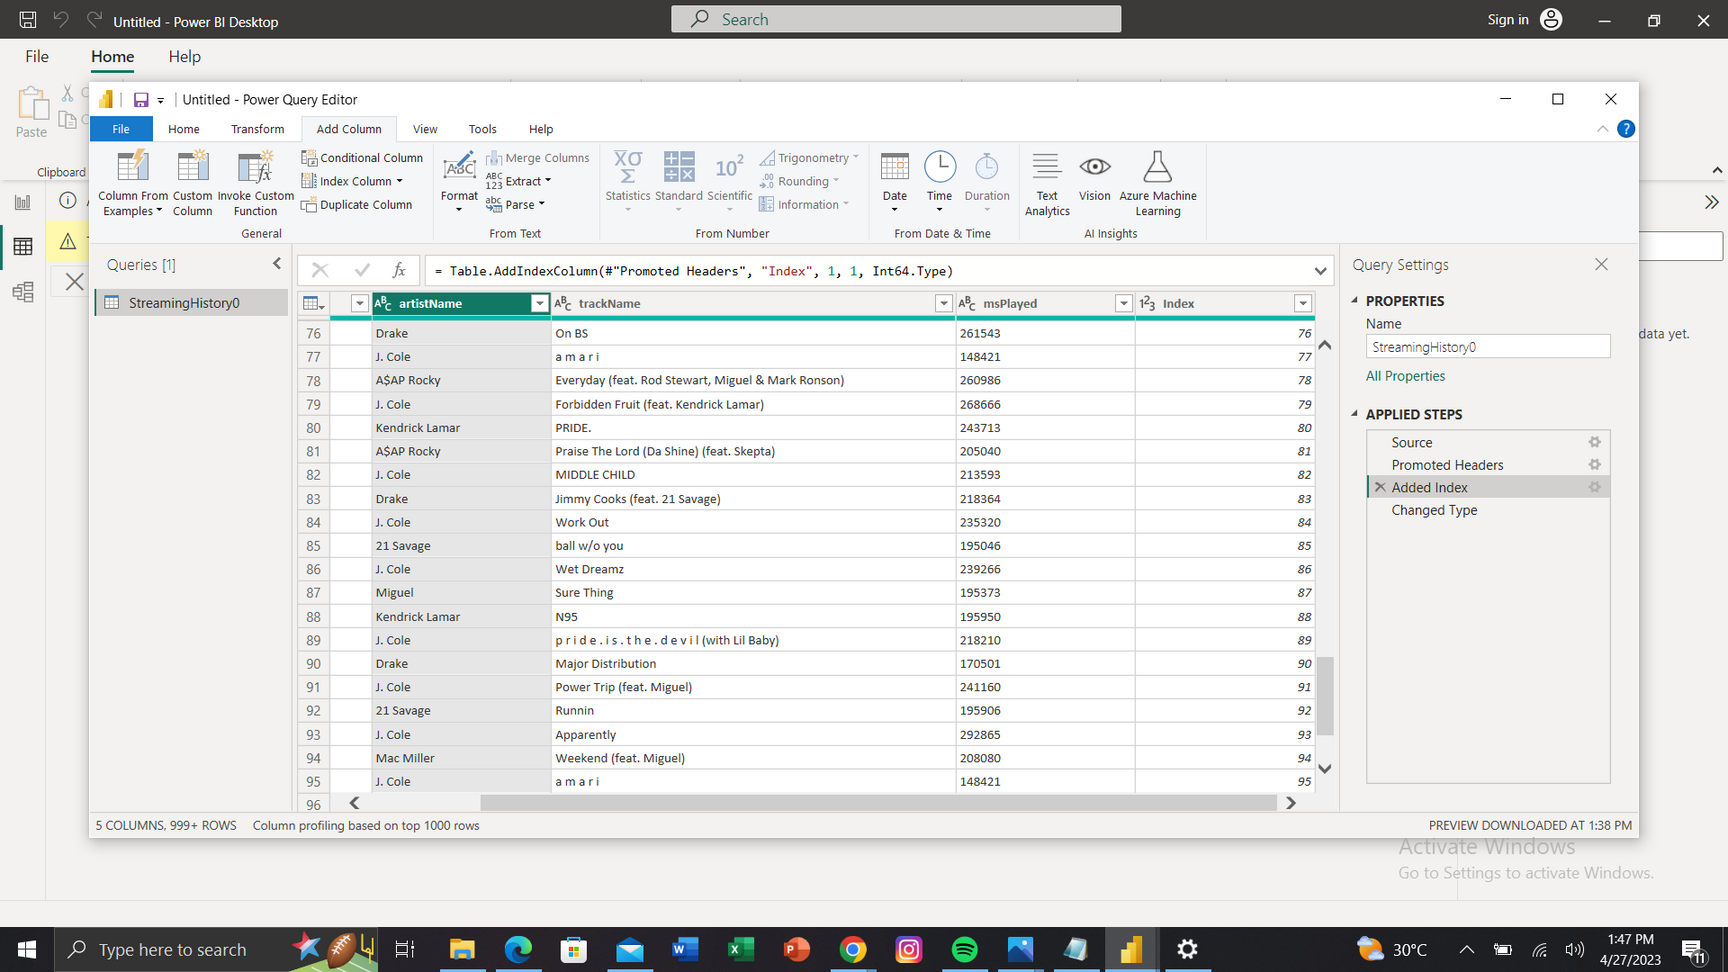
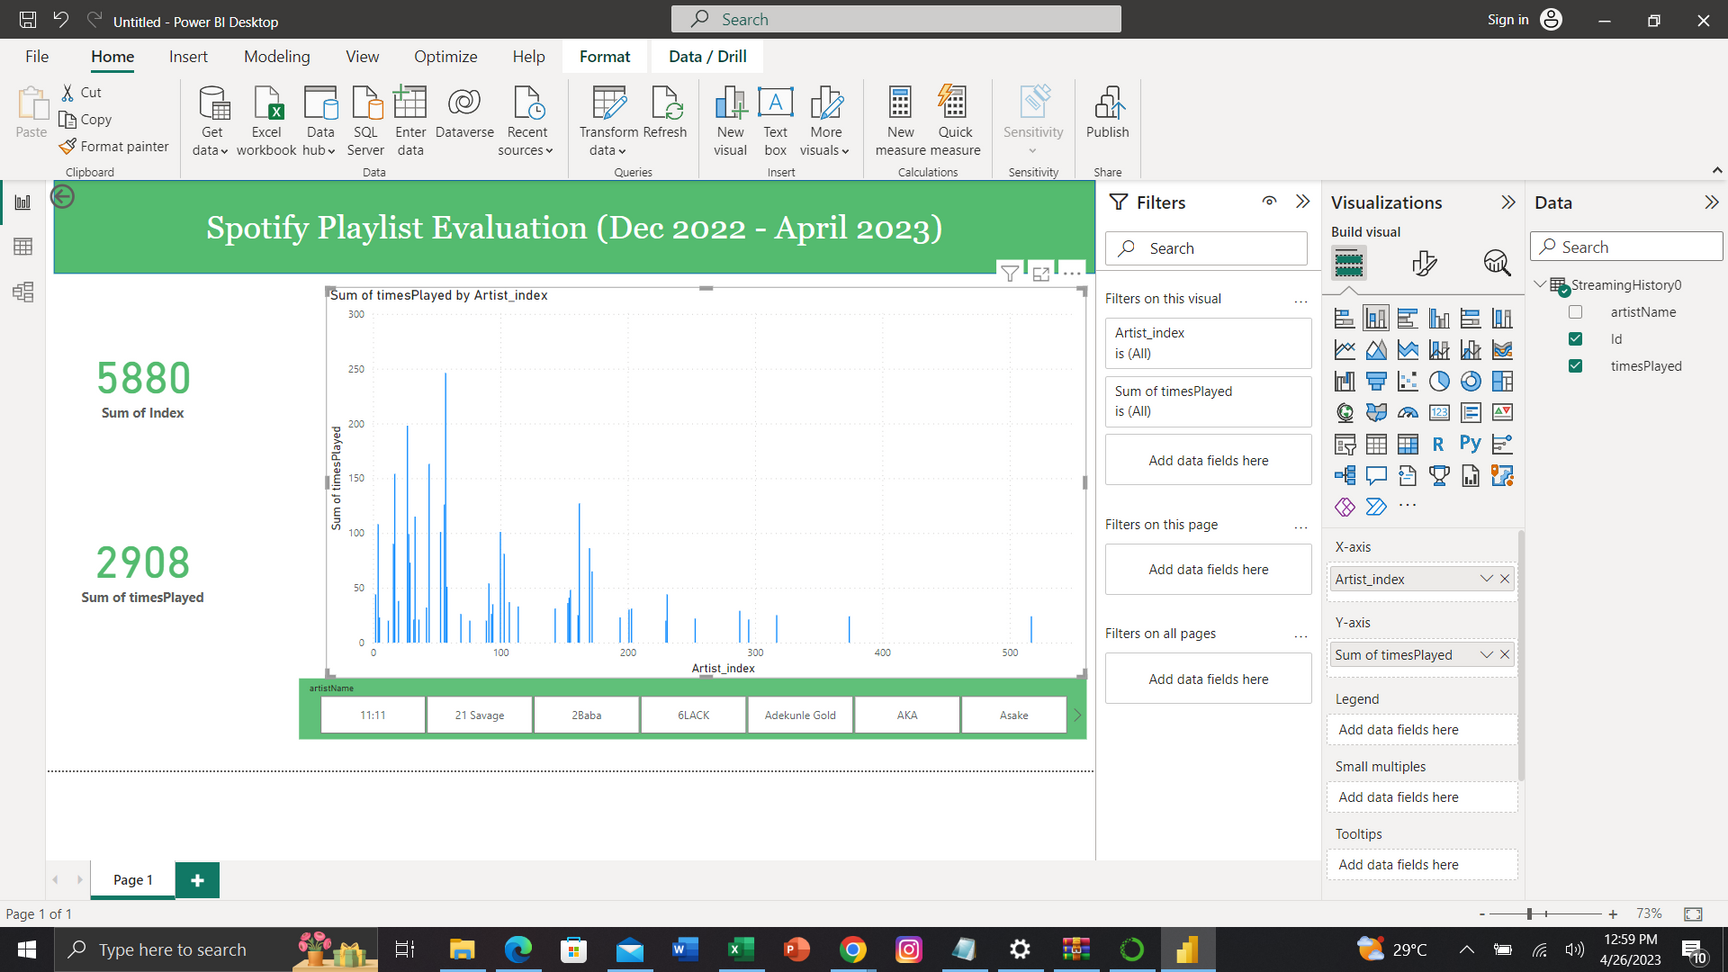
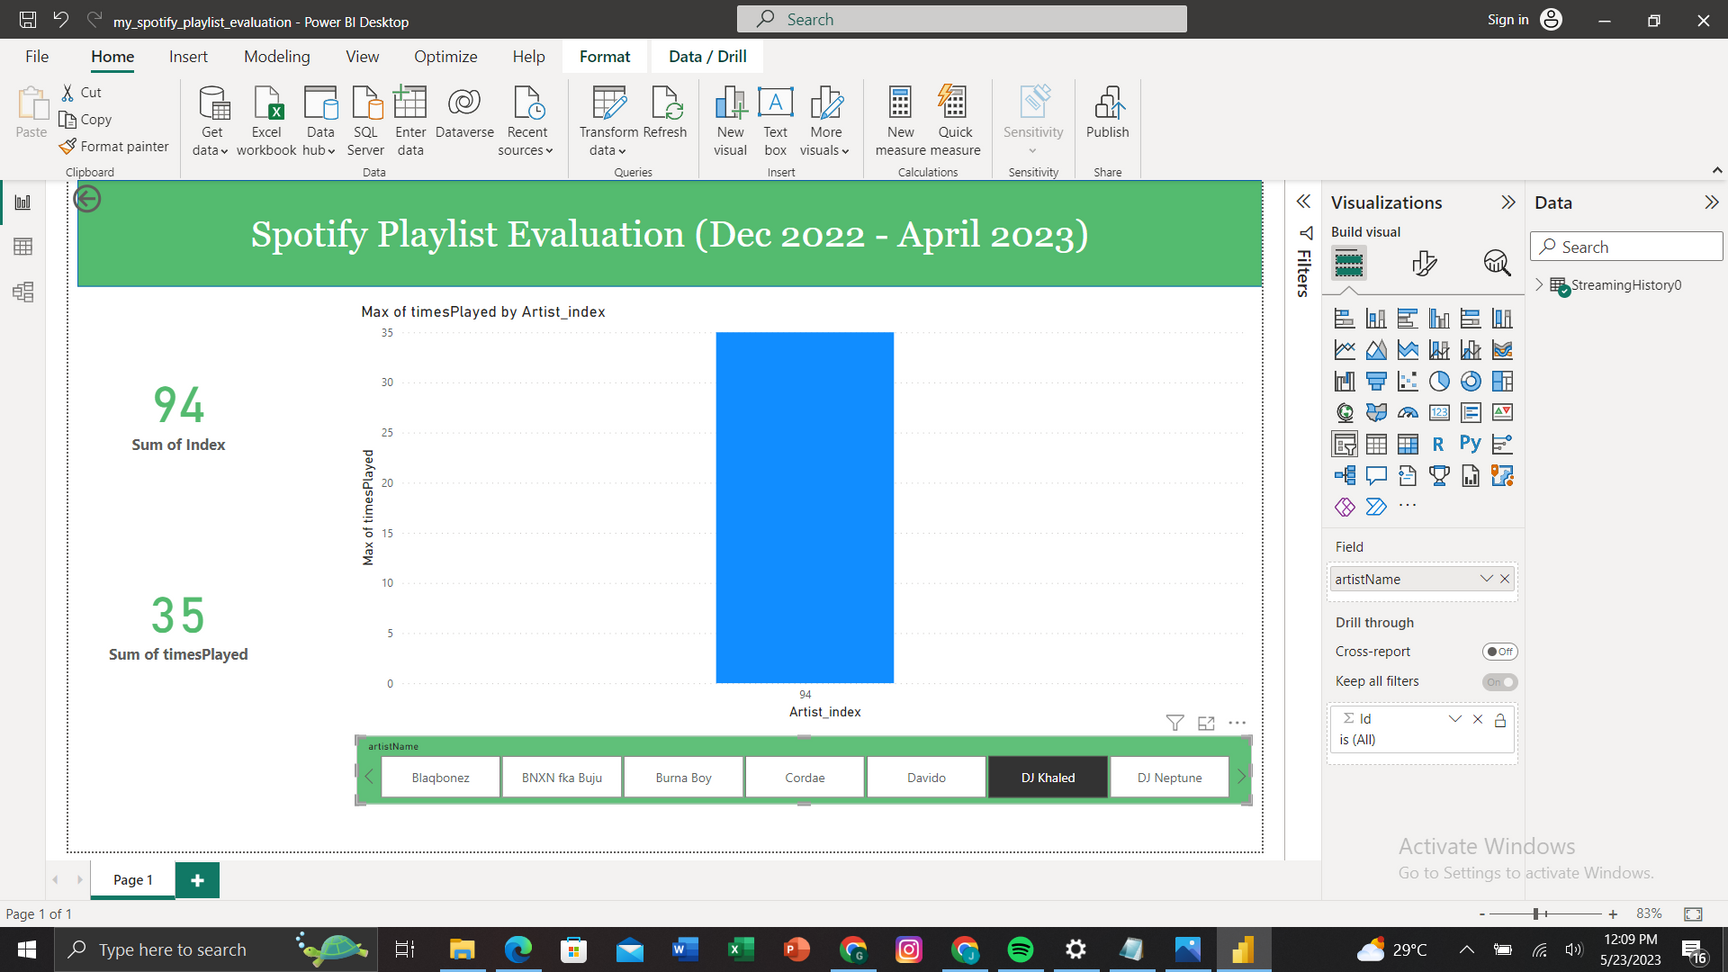
tITLE: Spotify streaming playlist (power BI)
Introduction: This project was carried out to analyze the number of music played and the number of times an artist was streamed on Spotify from a playlist within the last 4 months, Power BI was used to visualize data for accurate insight.
Methodology
Data Extraction
The first step is to extract the data from the Spotify streaming playlist. Spotify provides a Web API that allows developers to access various data points, including playlist information. You can use the Spotify Web API to fetch the playlist data in a suitable format, such as JSON or CSV.
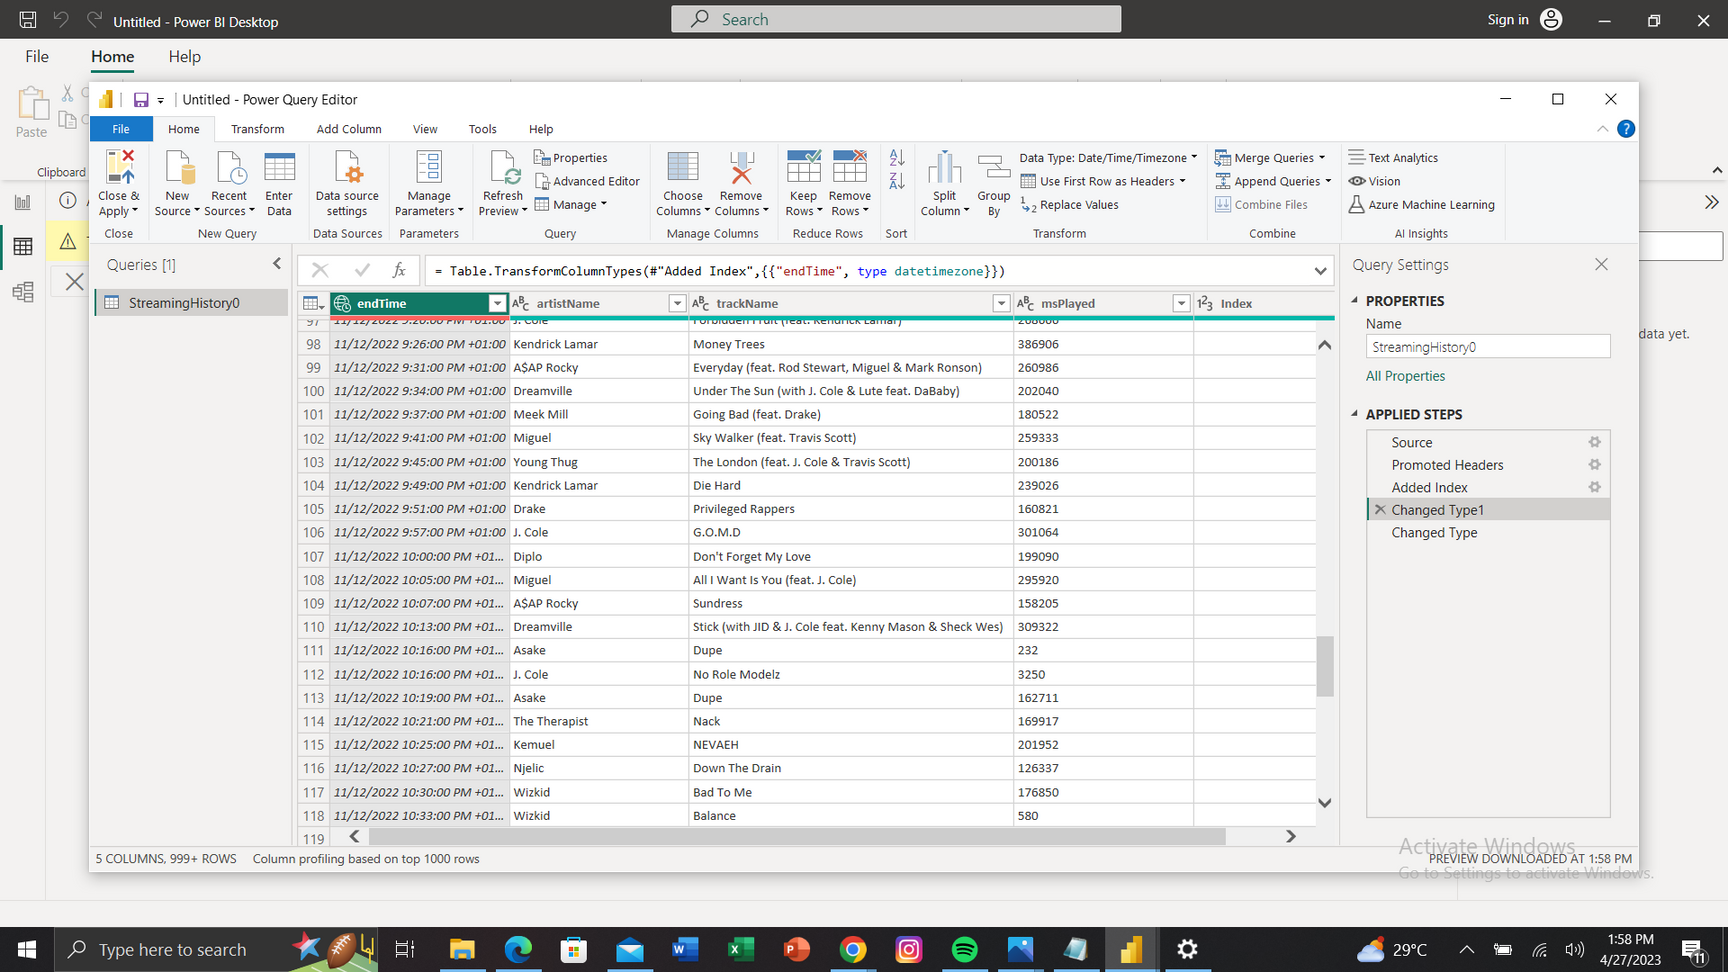
Data Transformation
Once you have the raw data, you may need to transform it into a format suitable for analysis. This could involve tasks such as cleaning the data, removing duplicates, handling missing values, and converting data types if necessary. You may also need to parse the data to extract relevant fields like song names and artist names.
Transformation
The playlist data was transformed by cleaning and all data was placed under the accurate variable for easy reading which was effectively done for data visualization.
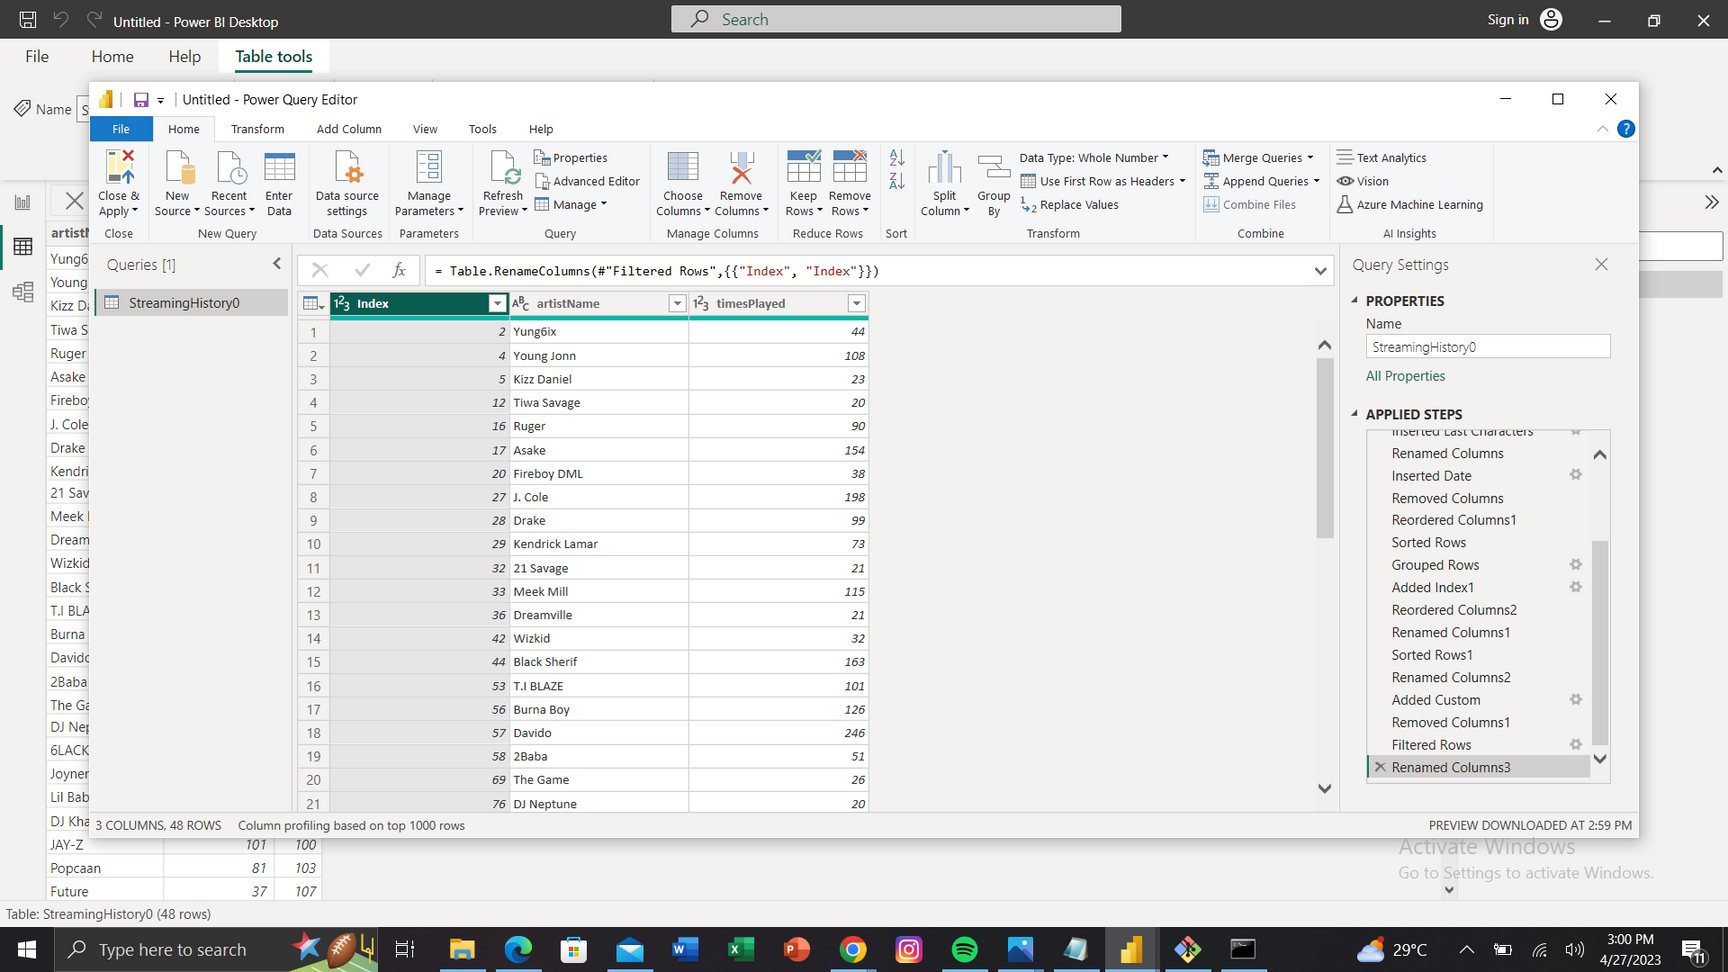
Aggregation
To determine the number of times each song was played and the corresponding artists, you'll need to aggregate the data. Group the songs by their names and count the occurrences to find the number of times each song was played. Similarly, group the data by the artist names to calculate the number of times each artist appeared in the playlist.
Data Visualization
Once you have aggregated the data, you can create visualizations using Power BI. Power BI offers a range of visualization options, such as bar charts, pie charts, and tables, to represent the information effectively. You can create a bar chart to display the top songs played, with the number of plays on the y-axis and the song names on the x-axis. Similarly, you can create a similar visualization for artists, with the artist names on the x-axis and the number of plays on the y-axis.
Dashboard Creation
Combine the visualizations into a cohesive dashboard in Power BI. Arrange the charts and tables in a logical manner to present the insights clearly. You can add filters and slicers to allow users to interact with the data, such as selecting a specific time range or filtering by genre.
Sharing and Collaboration
Finally, you can share your Power BI dashboard with others, allowing them to view and interact with the playlist analysis. Power BI provides options to publish the dashboard to the web, embed it in other applications, or share it with specific individuals or groups.
By following these steps, I was able to analyze a Spotify streaming playlist, determine the number of songs played, and visualize the data using Power BI to gain insights into the most popular songs and artists in the playlist.
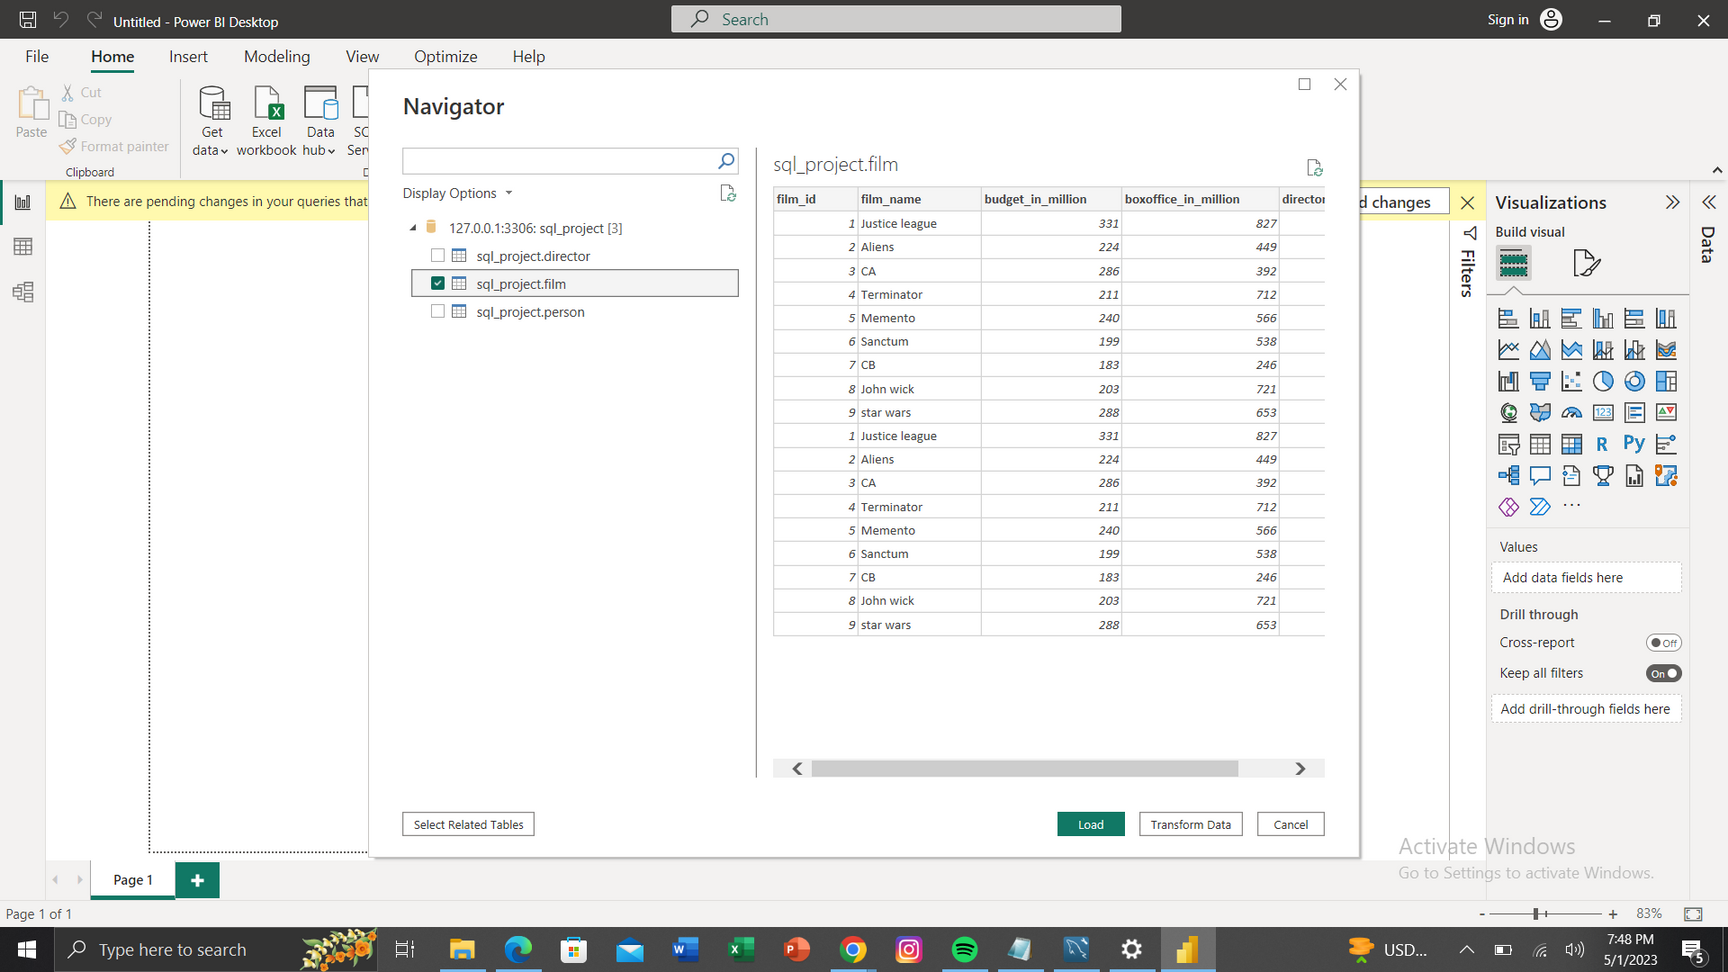
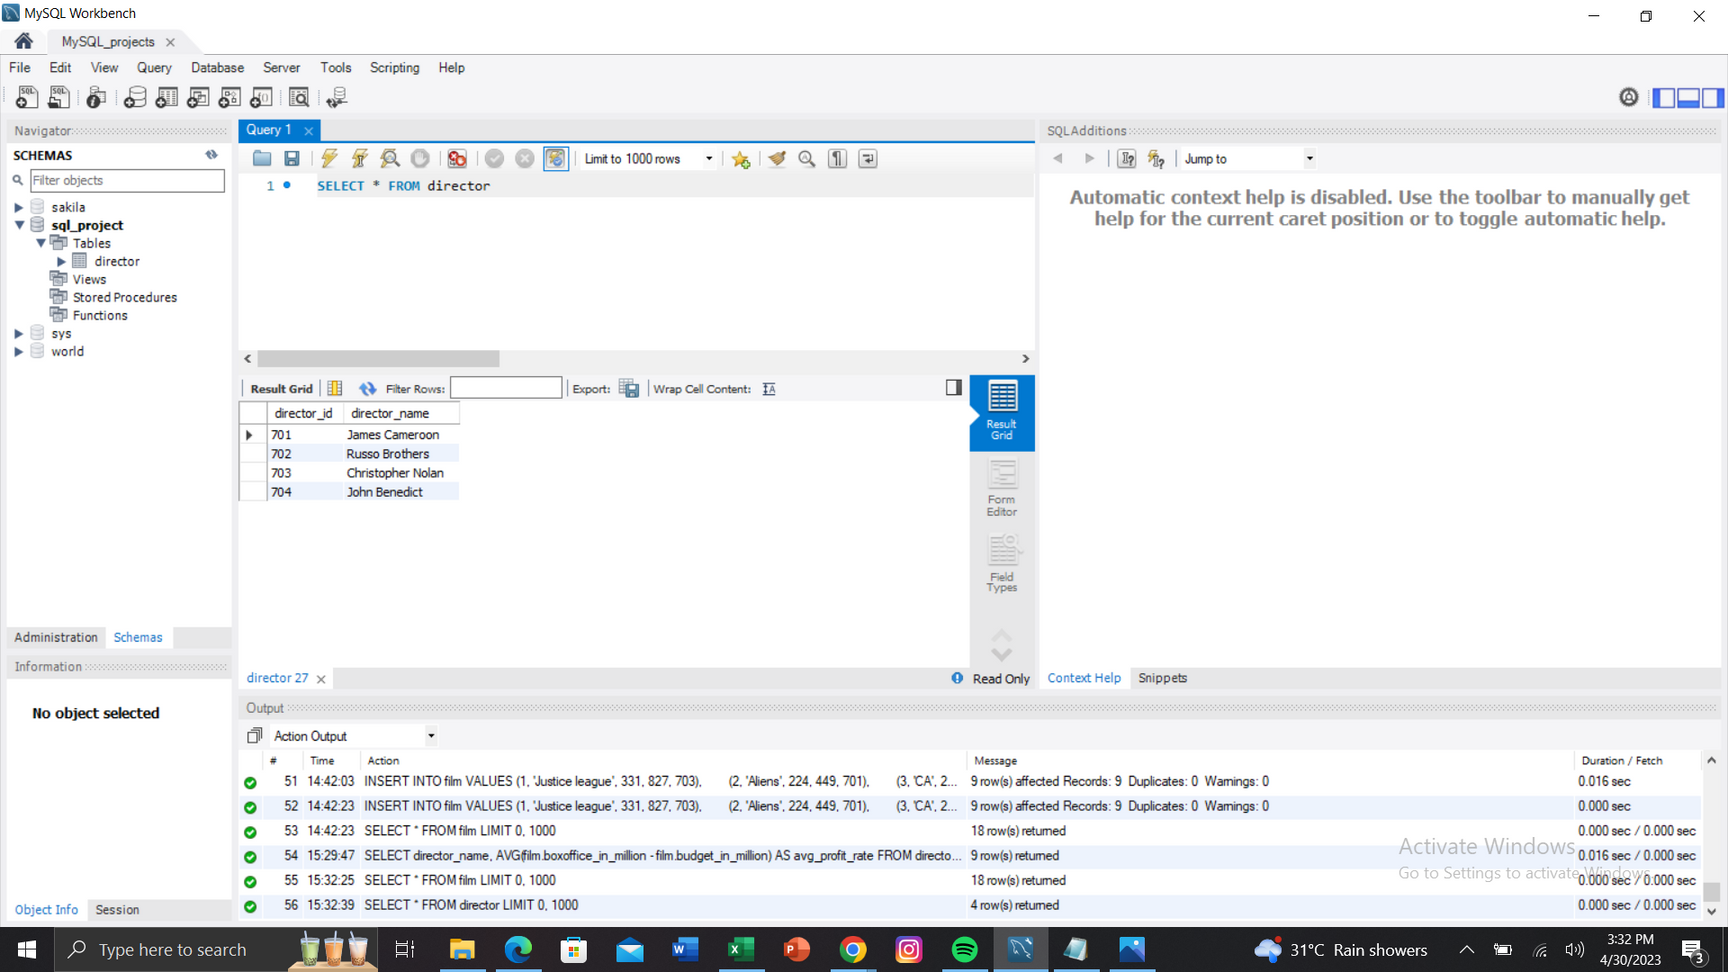
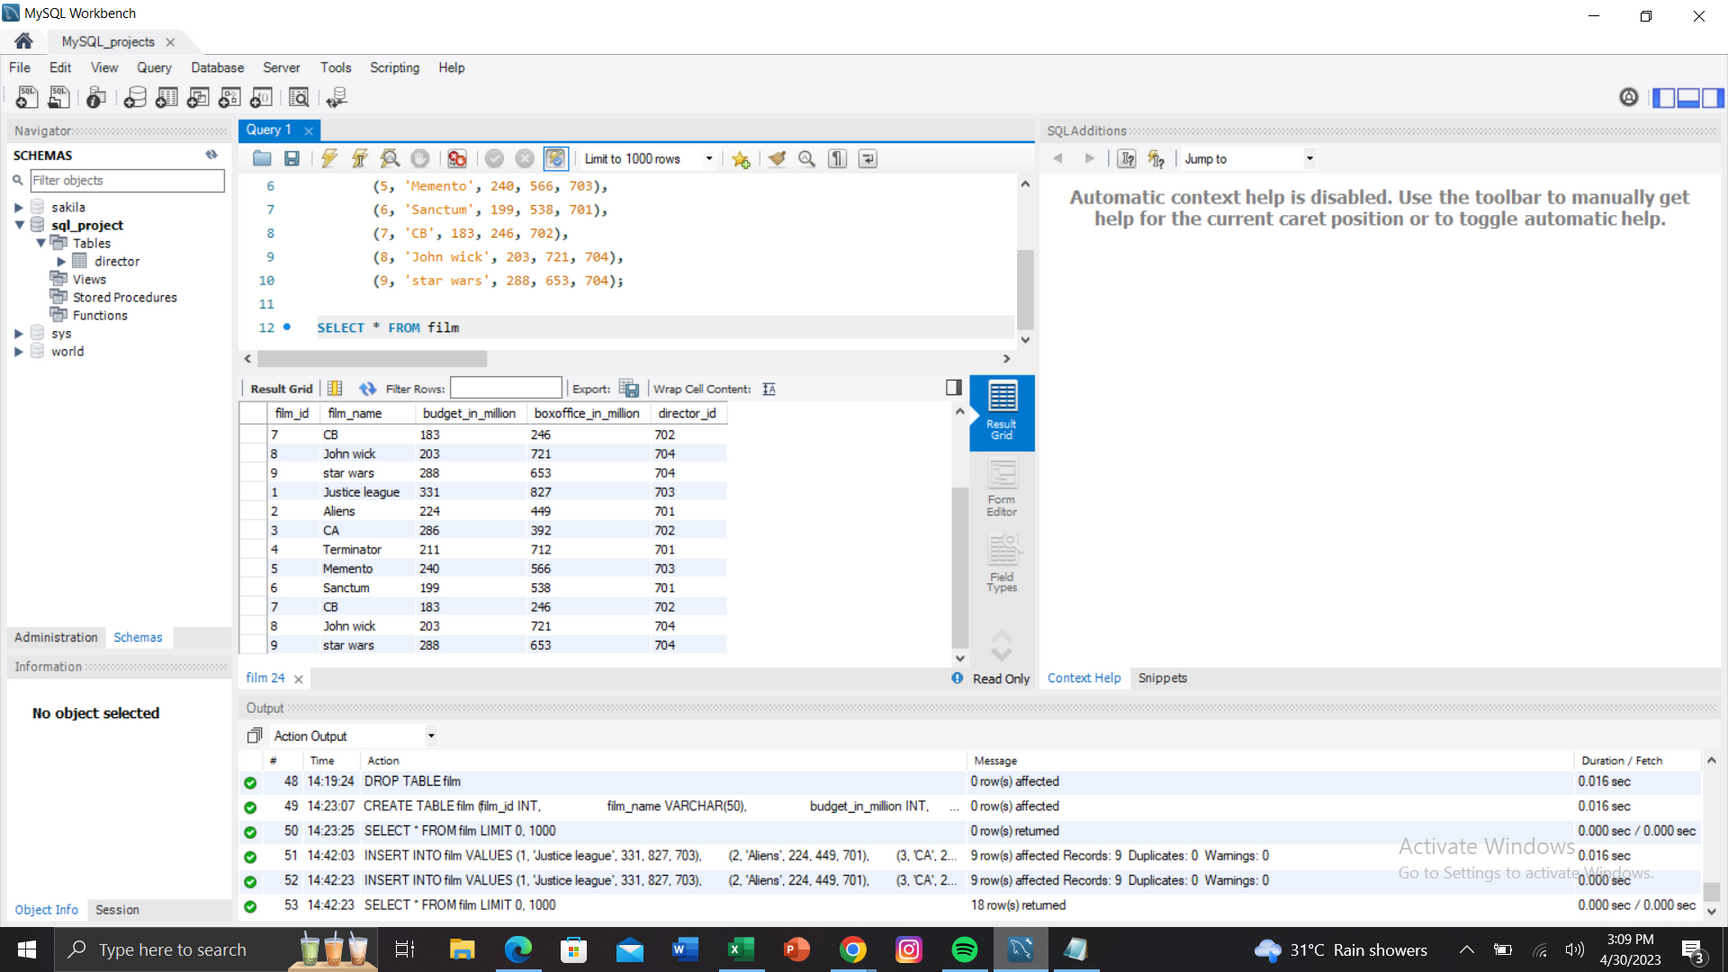
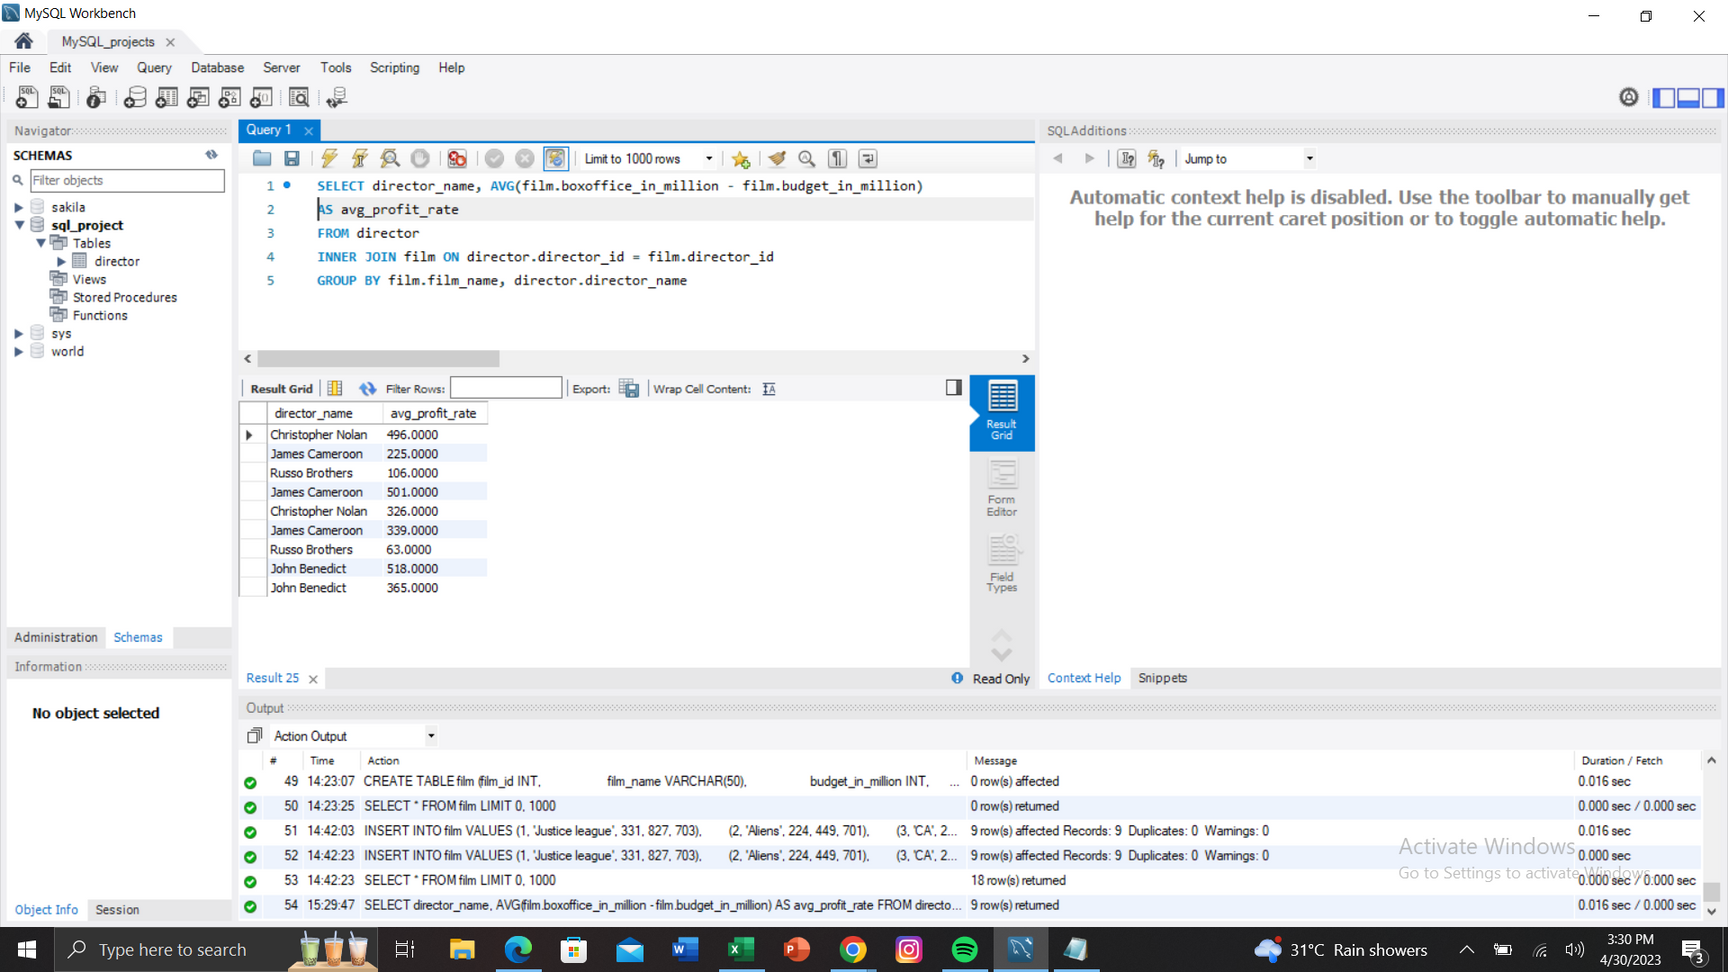
TITLE: Analyzing TOP 4 Hollywood Directors and their globetrotting films (MYSQL)
Given 2 tables namely Director and film. The director table maintains the ids and names of 4 famous directors that directed many globetrotting films, and the film table holds the details of their films. I have written an SQL query to fetch the names and the average profit rates of these 4 directors per film.
Table: Director
director_id | director_name |
701 | James Cameroon |
702 | Russo brothers |
703 | Christopher Nolan |
704 | John Benedict |
Table: Film
film_id | film_name | budget_in_million | box_office | |
1 | Justice league | 331 | 827 | 703 |
2 | Aliens | 224 | 449 | 701 |
3 | Captain America | 286 | 392 | 702 |
4 | Terminator | 211 | 712 | 701 |
5 | Memento | 240 | 566 | 703 |
6 | Sanctum | 199 | 538 | 701 |
7 | CB | 183 | 246 | 702 |
8 | John Wick | 203 | 721 | 704 |
9 | Star Wars | 288 | 653 | 704 |
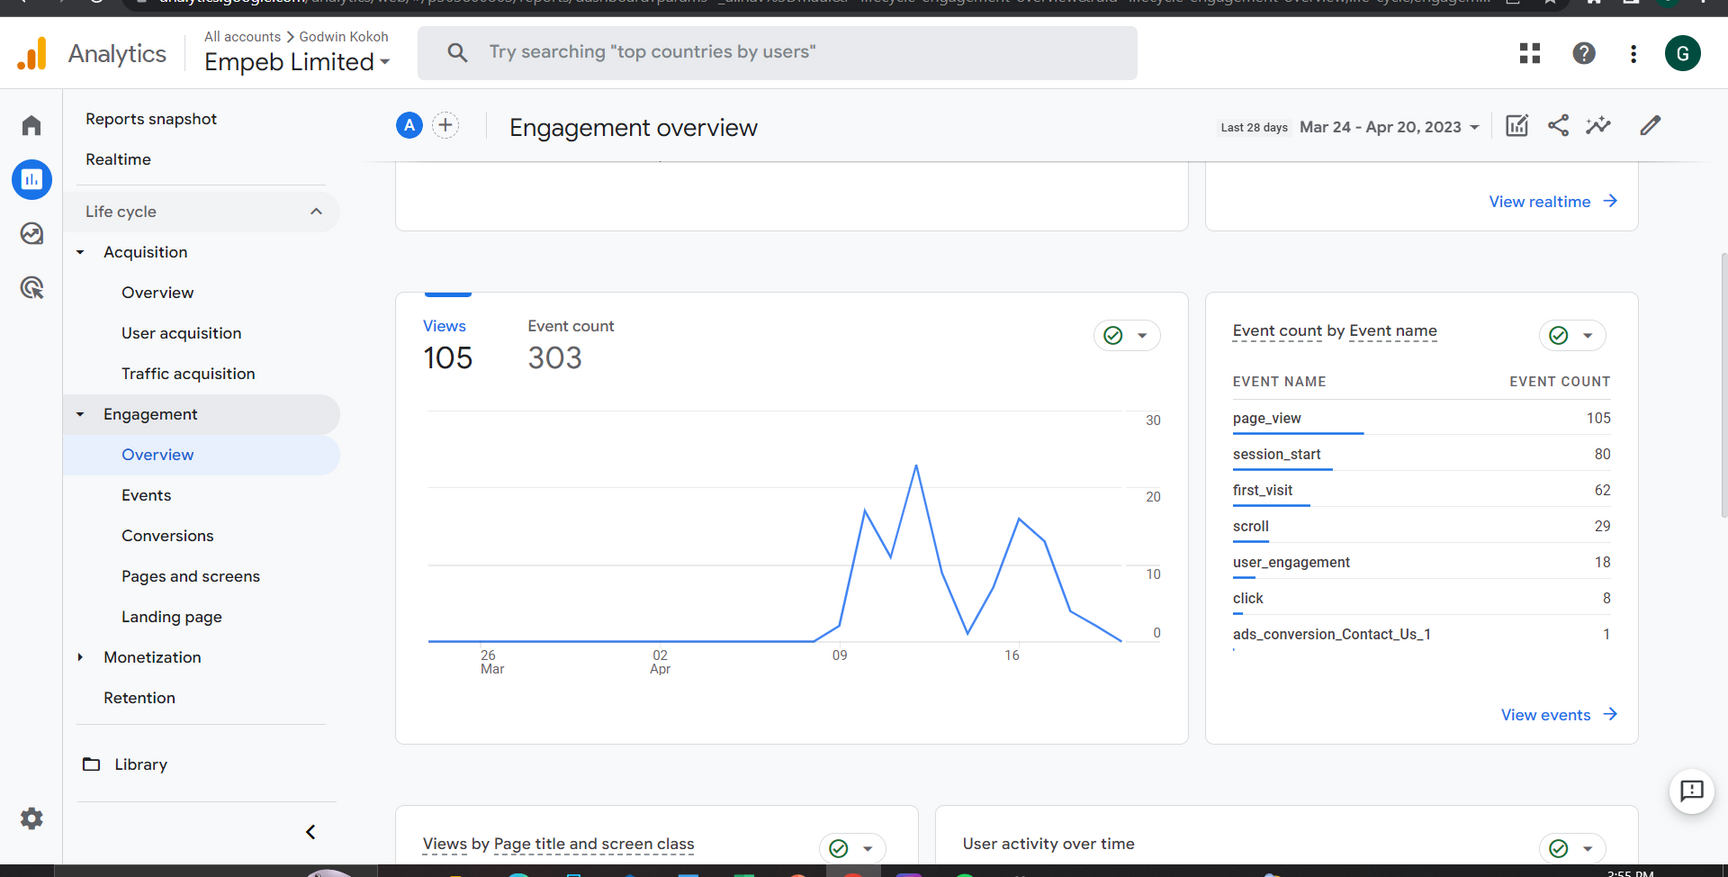
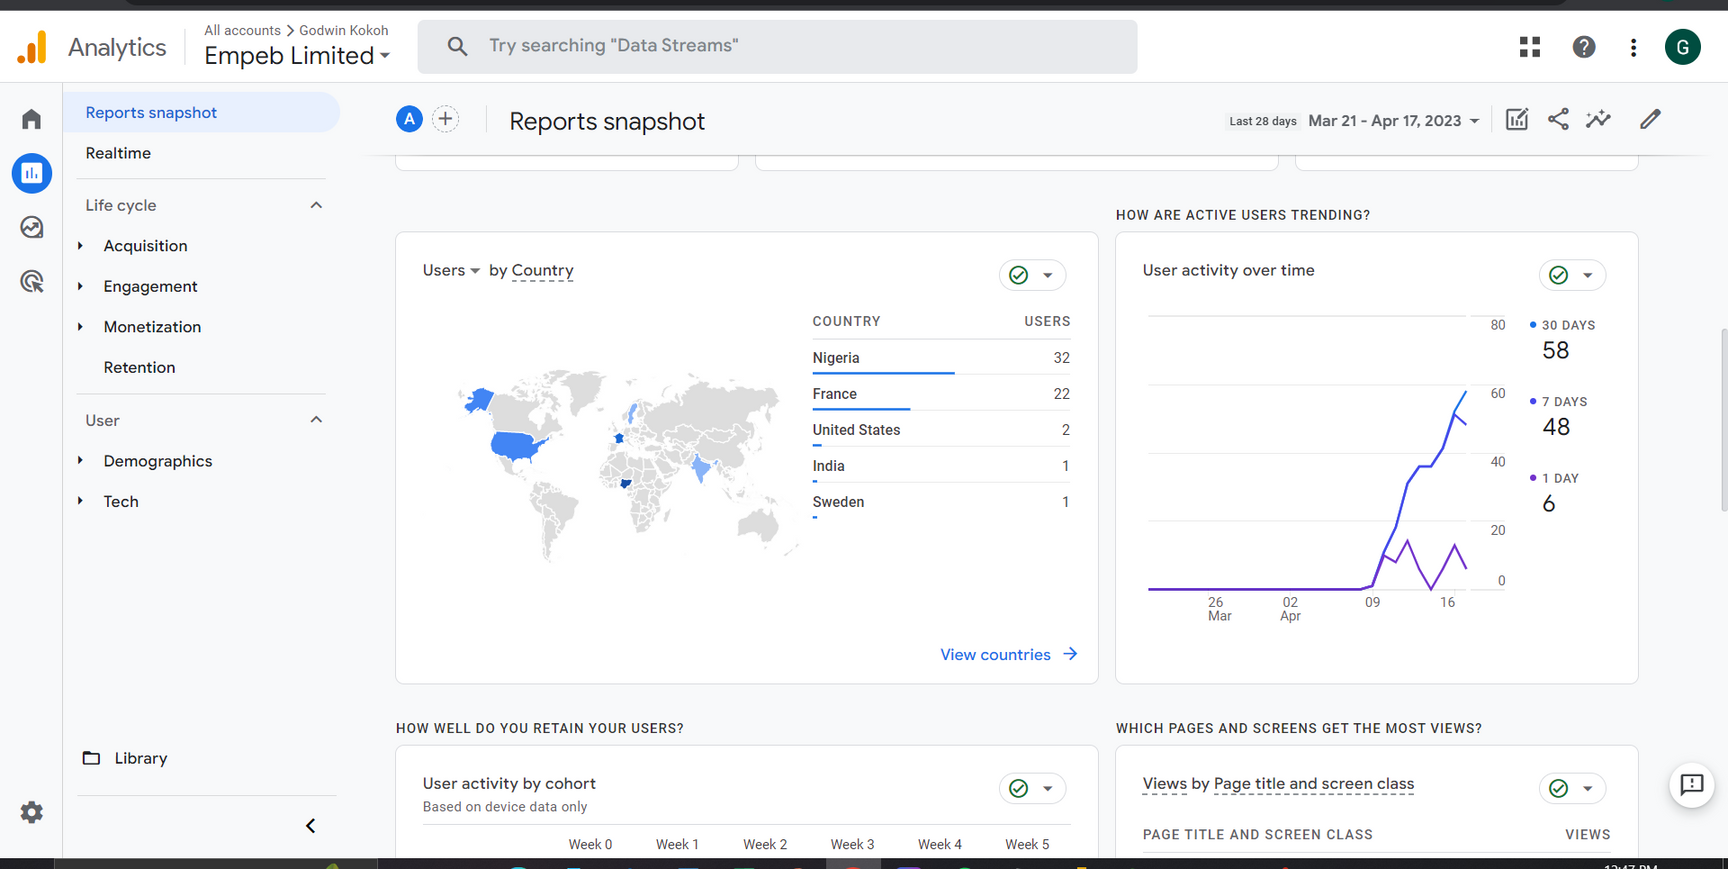
tITLE: Analyzing DATA FROM WEBSITE (GOOGLE ANALYTICS)
Real time traffic to a website was observed using data streamed directly using Google Analytics 4 (GA4). For insight on the pages visited and the top conversions.

work
with me
e-mail
godwinkokoh1@gmail.com
https://www.linkedin.com/in/godwin-kokoh-03326b115/